Through the Power BI implementation work we handle at Code Creators, we regularly work with models where performance problems come back to the same structural issues: oversized fact tables, unnecessary fields, poorly defined relationships, mixed levels of granularity, and models that do not follow a clear fact-and-dimension structure. This kind of hands-on work makes one thing clear: improving visuals or rewriting a few measures cannot fully solve performance problems when the underlying model is inefficient.
Effective Power BI data model optimization starts with building a model that Power BI can filter, aggregate, and query efficiently. A well-structured Power BI star schema, clear table roles, consistent fact-table grain, controlled relationships, and careful column selection all contribute directly to better performance and easier maintenance.
In this article, you will learn the Power BI data modeling practices that have the greatest impact on model size, query performance, relationship behavior, and long-term maintainability.
Start With a Power BI Star Schema
A Power BI star schema should usually form the foundation of an analytical model.
The structure separates your data into two main table types. Fact tables contain measurable business events, such as sales transactions, orders, inventory movements, support cases, or financial postings. Dimension tables contain the descriptive attributes that users rely on to filter and group those events, such as customers, products, departments, locations, and dates.
In Power BI model reviews, customer, product, region, date, and transaction fields often appear together in one large table. Separating transaction data into a central fact table and moving descriptive attributes into Customer, Product, Region, and Date dimensions gives the model a much clearer star-schema structure.
This separation gives Power BI clearer filtering paths and makes the model easier to understand. Microsoft specifically recommends keeping tables focused on either dimension or fact behavior rather than mixing both roles in the same table.
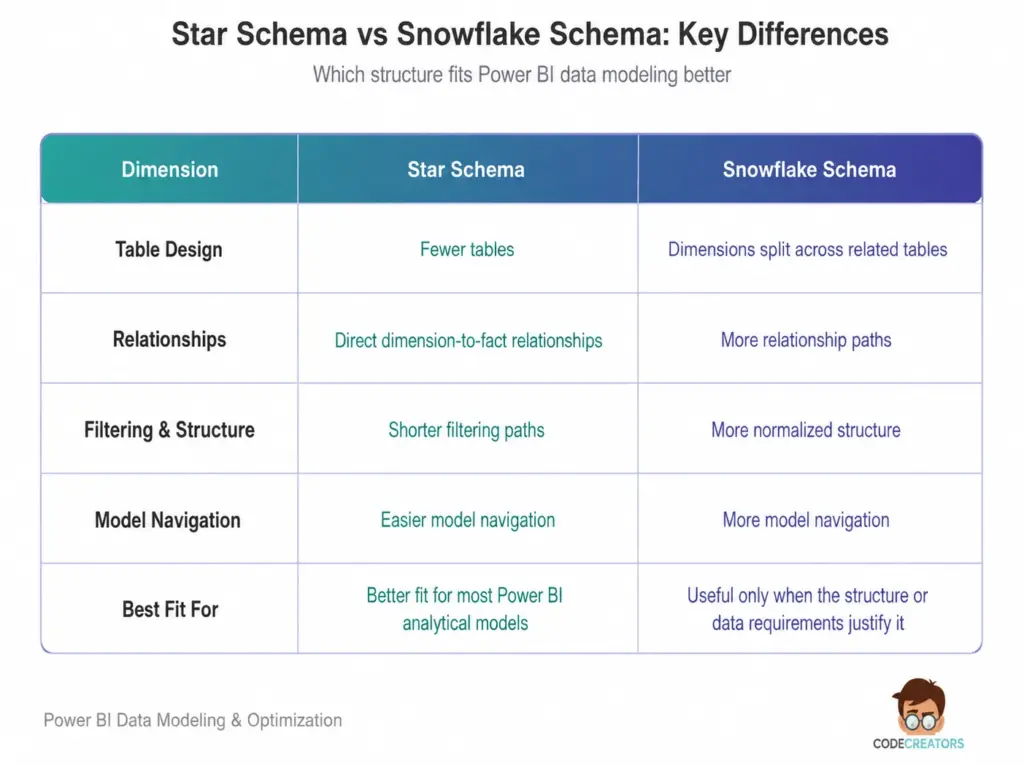
Avoid creating a heavily normalized snowflake structure simply because the source database uses one. Additional lookup tables create longer relationship paths and make the model harder for report authors to navigate. In many Power BI models, combining related descriptive attributes into one dimension produces a cleaner semantic layer.
Define the Grain of Every Fact Table
Before creating relationships or writing measures, decide exactly what one row in each fact table represents.
When reviewing fact tables, one of the first checks is whether every row follows a consistent grain. Sales models commonly use an order-line grain, service models often work at ticket level, and financial models may use an account-and-period grain.
Do not mix different levels of detail inside the same fact table unless the design specifically requires it.
One grain problem we regularly encounter is daily transaction data being modeled alongside monthly budget data without clearly separating their levels of detail. This structure can lead to unreliable aggregations and unnecessarily complex DAX. In practice, keeping the fact tables separate and connecting them through shared dimensions such as Date, Product, or Department creates a more reliable structure.
A consistent grain makes measures predictable and prevents hidden aggregation problems. Microsoft also identifies consistent fact-table grain as an important characteristic of a well-structured Power BI model.
Keep Relationships Simple and Intentional
Relationships determine how filters move through the model, so they directly affect both accuracy and performance.
In a typical star schema, dimension tables sit on the “one” side of a one-to-many relationship, while fact tables sit on the “many” side.
Whenever possible, use single-direction filtering from dimensions toward facts. This creates a clear path for filters and reduces ambiguity.
Bidirectional relationships can solve specific modeling requirements, but they should not become the default. When several tables filter each other in both directions, Power BI has more relationship paths to evaluate, and the model becomes harder to troubleshoot.
You should also avoid direct many-to-many relationships between fact tables when a shared dimension can solve the requirement. Microsoft recommends star-schema-style dimension tables instead of directly joining fact tables through many-to-many relationships in most analytical scenarios.
Remove Columns the Model Does Not Need
One of the simplest Power BI data model optimization techniques is also one of the most overlooked: stop loading unnecessary data.
Every imported column requires storage and increases the amount of data Power BI has to manage. In larger fact tables, unnecessary columns often contribute noticeably to model size because their values repeat across a high number of rows without adding useful reporting information.
Before loading a column, ask whether users need it for:
- Filtering or grouping
- Relationships
- DAX calculations
- Report output
If the answer is no, remove it in Power Query or, preferably, from the source query.
Pay particular attention to high-cardinality text columns such as transaction IDs, GUIDs, URLs, long descriptions, timestamps, and reference codes. Columns with many unique values generally compress less efficiently than low-cardinality columns.
Microsoft recommends reducing unnecessary rows and columns and optimizing data types to reduce Import model size. Numeric columns can also compress more efficiently than equivalent text values in suitable scenarios.
Use the Right Data Types
Incorrect data types waste memory and sometimes create unnecessary calculation work.
Do not store whole numbers as decimal values when decimals serve no purpose. Do not keep numeric identifiers as long text strings unless the text format has business meaning. Likewise, avoid storing a full timestamp when users only need the date.
Full transaction timestamps also appear frequently in models where reporting only happens at the daily level. Keeping unnecessary time-level detail increases column cardinality without improving the analysis, while a Date field can meet the same reporting requirement with a simpler model.
Data type decisions look small during development, but their effect grows with the number of rows in the model.
Prefer Measures for Aggregations
Calculated columns and measures solve different problems.
A calculated column produces and stores a value for every row in a table. A measure calculates results when the report queries the model.
Therefore, if you need calculations such as Total Sales, Average Order Value, Profit Margin, Year-to-Date Revenue, or Customer Count, create measures instead of adding row-level calculated columns solely to produce aggregates.
Calculated columns still have valid uses. You may need them for row-level classifications, sort columns, relationships, or attributes that users place on report axes. However, adding them without a clear modeling reason increases model size.
Keeping business calculations in well-designed measures also centralizes logic and makes the semantic model easier to maintain.
Build a Proper Date Dimension
Time-based reporting becomes far easier when the model contains a dedicated Date table.
Instead of relying on date fields scattered across fact tables, create one dimension with attributes such as Date, Year, Quarter, Month, Month Number, Week, and Fiscal Period where needed.
Then connect the Date dimension to the appropriate date key in the fact table.
If a fact table contains several meaningful dates, such as Order Date, Ship Date, and Delivery Date, decide which relationship should drive the default analysis. You can use inactive relationships with DAX when users need alternative date contexts, or use role-playing date dimensions when the reporting experience requires separate filtering behavior.
The goal is to make time analysis deliberate rather than allowing date logic to develop independently across report pages.
Choose Storage Mode Based on the Workload
Import mode usually provides the strongest interactive performance because Power BI queries the in-memory semantic model. Microsoft describes Import as the most common storage mode and notes its fast in-memory query performance.
However, importing everything does not always make sense.
Very large datasets, near-real-time requirements, or data-governance restrictions may require DirectQuery or a composite model. In those cases, optimization becomes even more important because poorly designed visuals or relationships can generate expensive queries against the source system.
Do not choose DirectQuery simply because the source contains a large amount of data. First determine how much historical detail the report actually needs. Removing unused rows, aggregating older data, or using incremental strategies may produce a simpler solution.
Keep Power Query Transformations Efficient
Model optimization also starts before data reaches the semantic model.
Use Power Query to clean, reshape, and prepare data, but avoid unnecessary transformation chains. When the data source supports it, preserve query folding so Power Query can push suitable transformation work back to the source system rather than processing everything locally.
You should also filter unnecessary rows as early as possible and avoid importing intermediate queries that exist only to support other transformations.
For larger enterprise implementations, consider moving complex transformation logic into a warehouse or ETL process instead of forcing Power BI Desktop to perform extensive data engineering. Microsoft similarly recommends considering a data warehouse and ETL process when large volumes or advanced dimensional modeling requirements make Power Query transformations difficult to manage.
Test the Model Instead of Guessing
Optimization should rely on evidence.
Once the model works, test common report interactions and identify where delays occur. Power BI’s Performance Analyzer can help you examine visual query times and identify expensive calculations.
Then work backward.
If a visual performs poorly, check the DAX, relationship paths, cardinality, storage mode, and amount of data involved before redesigning the visual itself. Microsoft includes DAX optimization, cardinality reduction, aggregations, and Performance Analyzer as core techniques for diagnosing semantic model performance.
This approach prevents random optimization changes and helps you focus on the part of the model that actually creates the bottleneck.
How Code Creators Helps Optimize Power BI Data Models
Power BI performance problems often require more than isolated changes to visuals or DAX measures. At Code Creators, our Power BI work includes reviewing data models, relationship structures, table design, data volume, and calculation logic to identify the areas that create unnecessary complexity or slow report performance.
The focus is on building models that remain efficient as reporting requirements grow. That can include restructuring data around a clear star schema, separating facts and dimensions, simplifying relationship paths, removing unnecessary columns, reducing high-cardinality fields, and choosing storage strategies that match the reporting workload. We also look at how the model supports day-to-day report development so future measures, filters, and dashboards remain easier to maintain.
If your Power BI reports are becoming slower, harder to manage, or increasingly complex as data grows, contact us to review and optimize your Power BI data model for better performance, scalability, and maintainability.
Conclusion
Strong Power BI performance depends heavily on decisions made before users ever see the dashboard. A clean star schema, consistent fact-table grain, controlled relationships, appropriate data types, lower cardinality, and fewer unnecessary columns give Power BI a simpler model to query and give report developers a clearer model to work with.
For most projects, the best place to begin Power BI data model optimization is not advanced DAX tuning. Start by reviewing the structure. Confirm that fact and dimension tables have clear roles, simplify relationship paths, remove data that reports do not use, and verify that every table operates at a defined grain.
Once that foundation is correct, measures become easier to write, filters behave more predictably, and performance tuning becomes much more targeted. A well-designed Power BI star schema therefore does more than improve speed; it creates a semantic model that remains understandable and maintainable as reporting requirements grow.
For organizations looking to improve reporting performance without adding more complexity to the model, our Power BI consulting services provide a practical way to strengthen model structure, simplify relationships, and support future reporting needs. Connect with our Power BI specialists to build a model that stays fast, reliable, and easier to manage as your data grows.