Power Apps Power BI integration connects Microsoft’s reporting and app-building tools in one of two directions: embedding a Power Apps screen inside a Power BI report for write-back, or embedding a live Power BI visual inside a Power Apps screen for in-context analytics. At Code Creators, the projects we’ve built using this pattern almost always run into the same two snags, regardless of which direction they go: someone forgets the app and the underlying data source both need to be shared separately from the report, and someone assumes write-back will be instant without checking whether the underlying data source can actually delegate the query.
This guide walks through how to architect, configure, and secure interactive data workflows between Power Apps and Power BI, with practical setup steps and the governance details that matter once real users start relying on it.
Why Combining Power Apps and Power BI Drives Operational Value
Separating analytics from daily operational applications creates workflow delays and data discrepancies. When a report viewer notices an inventory shortage or a customer status change on a Power BI dashboard, they normally have to open a separate system to update those records manually.
Connecting the two closes that gap in a few concrete ways. Records update directly, since a report canvas can write back to underlying databases, SQL tables, or SharePoint lists without opening external software. Decisions get more contextual, since an embedded app can filter automatically based on whatever visual selection or slicer an analyst has active. Operations move faster, since a report screen can trigger Power Automate flows, email notifications, or approval steps directly. And the user experience gets simpler, since live performance metrics and interactive data entry can live on a single screen instead of two separate tools.
Phase 1: Architectural Patterns for Power Platform Connectivity
Organizations connect Power Apps and Power BI using two primary approaches, depending on whether the user’s starting point is an analytics report or a transactional application.
Pattern A: Embedding Power Apps Inside Power BI Reports
In this layout, report designers add the native Power Apps custom visual onto a Power BI report page. This report lets viewers inspect complex charts, filter specific data rows, and use the embedded app screen to modify records instantly.
Key capabilities include:
- Automatic context passing. Selected table row items pass directly into the embedded app form as input variables.
- Instant dataset refreshing. Report visuals update immediately after a user submits data edits inside the app.
- In-line approvals. Executives can review KPI variances and approve budget requests directly on the report canvas.
Pattern B: Embedding Power BI Visuals Inside Power Apps
In this configuration, app developers embed live Power BI tiles, interactive dashboards, or complete report pages directly into canvas or model-driven apps. This pattern suits field workers and frontline staff who spend most of their time inside a transactional app rather than a reporting tool.
Key capabilities include:
- Contextual analytics. Personal performance metrics, historical sales trends, or asset history display directly alongside data entry forms.
- Filtered visual loading. App parameters, such as an active customer ID, filter the embedded report visual automatically.
- Mobile-optimized displays. Interactive charts render cleanly inside mobile app views without needing a separate browser window.
Phase 2: How to Integrate Power Apps With Power BI Step-by-Step
Building an interactive report with write-back capability means configuring data fields, setting up environment connections, and linking context parameters inside Power BI Desktop. The setup runs in order: add the Power Apps custom visual to the report canvas, drag the context fields you need into the visual’s data bucket, select a target environment and generate (or connect) the app, then reference PowerBIIntegration.Data in your app’s PowerFx formulas.
Step 1: Add the Power Apps Visual
Open your report in Power BI Desktop and select the Power Apps for Power BI visual from the Visualization pane. Position and resize the visual box on your report canvas where you want the interactive app screen to appear.
Step 2: Pass Data Context Fields
To connect the two effectively, drag the data fields you want to pass to the app, such as ProductID, CurrentStock, or ManagerEmail, directly into the Power Apps visual’s data field bucket. This creates a dynamic integration object inside the app’s configuration environment.
Step 3: Create or Select Your App
Click Choose app inside the visual box to connect an existing app, or click Create new to generate a fresh canvas app tailored to your report dataset. Power BI launches Power Apps Studio automatically and builds a pre-configured integration control object called PowerBIIntegration.
Step 4: Configure Write-Back Logic With PowerFx
To read data passed from your report visuals, set your app gallery or form item property to use the integration dataset formula:
PowerBIIntegration.Data
To refresh report visuals automatically after writing data back to your underlying database, append the refresh command to your form’s OnSuccess property:
PowerBIIntegration.Refresh()
If you’re planning a write-back app of any real complexity, this is exactly where a few hours of architecture planning up front saves a lot of rework later, the Power Apps Services team at Code Creators can help scope the data model and delegation strategy before you start building against it.
Phase 3: How to Integrate Power BI in Power Apps Applications
For app developers looking to surface analytics inside custom applications, Microsoft provides a native control that makes embedded reporting straightforward.
Step 1: Insert the Power BI Tile Control
The Power BI tile control is a standard, generally available control, not a preview feature you need to enable separately. Open Power Apps Studio, select the Insert menu, expand the Display or Charts category, and select Power BI tile. Place the control frame onto your canvas screen where field users need analytical visibility. Worth knowing before you build: Microsoft recommends loading no more than three Power BI tiles at once inside a single app, since additional tiles start affecting performance, and the control isn’t available in GCC High, DoD, or China environments.
Step 2: Bind Workspace and Report Parameters
Select the embedded tile control frame and use the dropdown properties panel to assign your workspace, target report, and specific visual tile. To filter the report visual dynamically based on items selected inside your app, configure the TileUrl property string using PowerFx filtering parameters.
A Sharing Detail That Trips Up Almost Everyone
Publishing a report with an embedded Power BI tile doesn’t automatically grant access to the underlying dashboard the tile comes from. We’ve seen this exact gap cause a wave of “why is my tile blank” tickets after launch, the app itself can be shared correctly and the tile will still show up empty for anyone who wasn’t separately given access to the source dashboard. Share the app and the dashboard together, every time, or plan on fielding that support ticket.
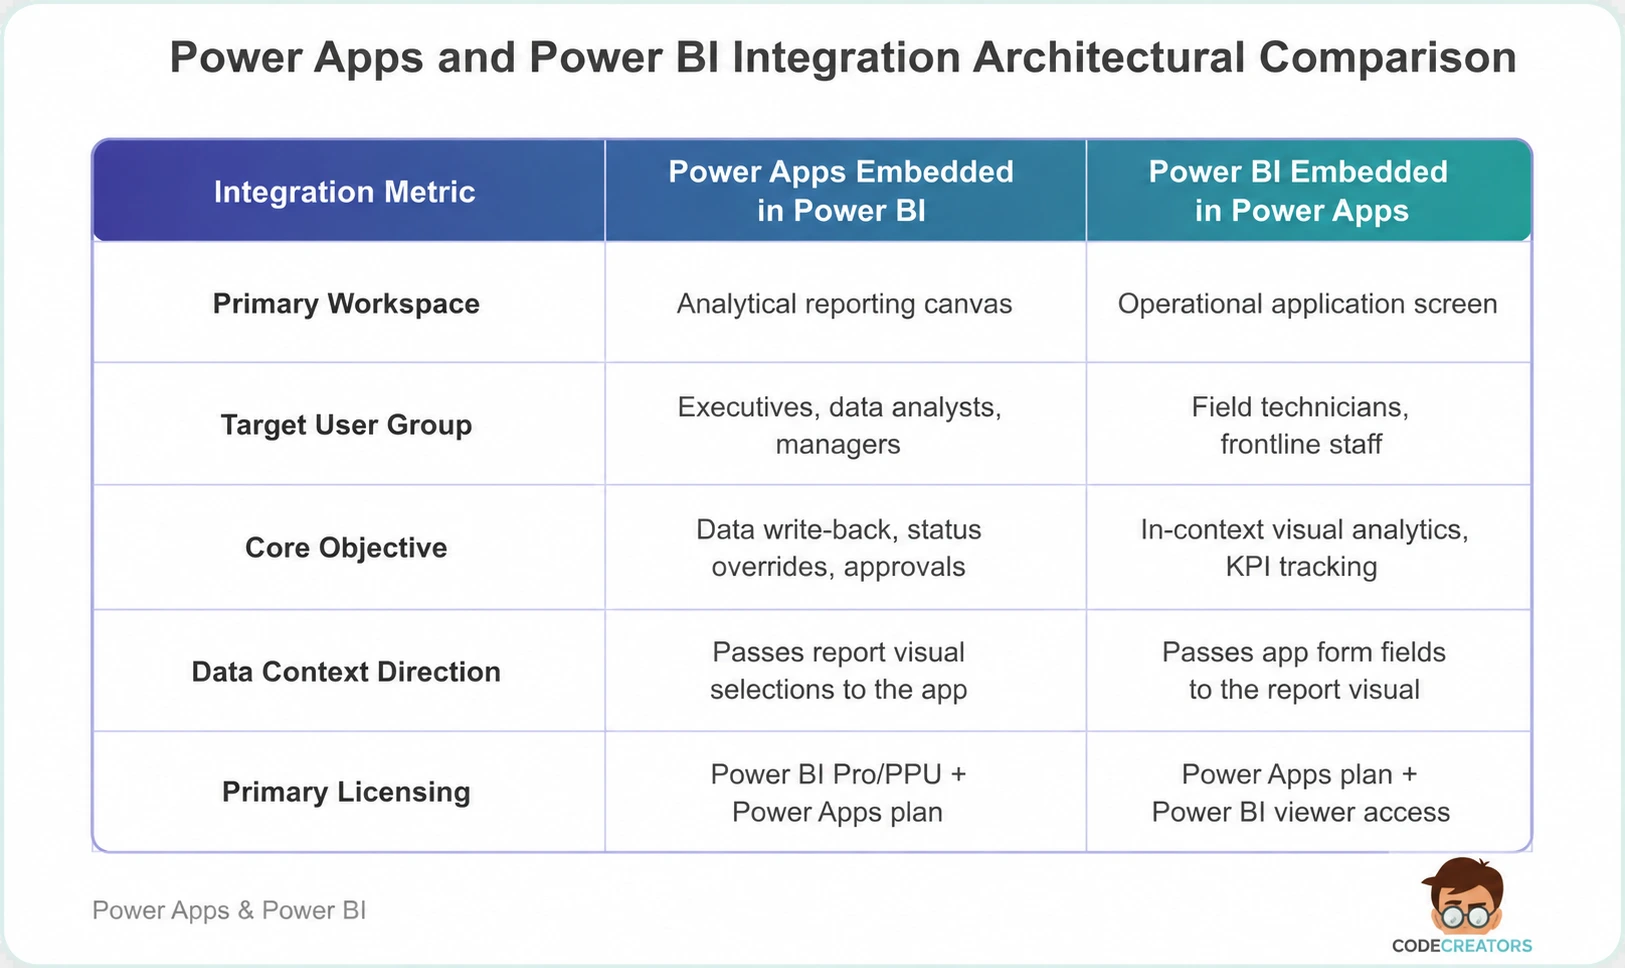
Operational Integration Matrix
Choosing the right integration pattern depends on user roles, dataset size, and required transactional speed.
Licensing and User Permissions
What licenses do users need to view and interact with embedded Power Apps inside Power BI reports?
Users need active permissions and licenses across both services to access an integrated interface. To view a report containing an embedded app, a user needs a valid Power BI Pro or Premium Per User (PPU) license, or access to the report through a Power BI Premium capacity workspace. They also need an appropriate Power Apps plan, either a per-user plan or a per-app pass, and explicit read/write security permissions on both the embedded canvas app and its underlying data source, such as Dataverse, SQL Server, or SharePoint.
Technical Governance and Best Practices for Integrated Portals
Deploying interconnected apps and reports across enterprise business units requires real technical governance to preserve platform stability, security, and performance.
Optimize Data Source Connections
Avoid connecting embedded apps directly to unindexed legacy data sources. Indexed keys and delegable query logic on your underlying database, whether SQL Server or Dataverse, keep write-back requests feeling responsive rather than sluggish. How fast is fast enough depends on your data source, network conditions, and query complexity, so treat quick response times as the goal you’re designing toward rather than a fixed number you’re guaranteed just because a table is indexed.
Manage Sharing Permissions Centrally
Publishing an integrated Power BI report doesn’t automatically grant users access to embedded Power Apps or underlying data tables. Administrators need to share the report, the embedded app, and the custom database connectors together, or end users hit “Access Denied” screens that look like a bug but are really a permissions gap.
Manage Capacity Limits and Delegation Rules
Keep app formulas light and delegate query operations to the underlying server whenever possible. Use local collection variables inside Power Apps to store temporary inputs before executing batch update commands back to your cloud database.
Building This So It Holds Up
Power Apps and Power BI integration turns static dashboards into places people can actually act on what they’re seeing, but the parts that make it reliable, like sharing permissions, delegation, and licensing, are exactly the parts that are easy to overlook while you’re focused on getting the visual right.
If you’re planning an integrated portal and want a second opinion on architecture before you build, the Power BI integration services at Code Creators can help you get the data model and permission structure right from the start.