
In the ever-changing world of engineering, data surrounds you. It exists within project timelines, inventory, budget spreadsheets, and health and safety logs. But for most project managers, this data is locked away. It exists in different files scattered across different folders, making it difficult to get the “big picture” in real-time. This is where Power BI and SharePoint engineering dashboards change the game.
By using the document management capabilities of SharePoint and the analytical capabilities of Power BI, you can turn static documents into real-time, interactive insights. You stop looking at what happened last month and start seeing what is happening right now. This guide walks you through the technical steps to build a unified reporting system that keeps your projects on track and your stakeholders informed.
The Value of Unified Engineering Data
Most firms struggle with fragmented information. By combining these tools, you can create a single source of truth to monitor engineering project KPIs without having to manually input data. This integration is critical in today’s Project Portfolio Management, where real-time accuracy is the difference between profit and loss.
What Key Performance Indicators (KPIs) Matter Most in Engineering?
To drive ROI, your dashboard must focus on the metrics that define project success.
| Engineering KPI | Definition | Strategic Value |
| Schedule Variance (SV) | The difference between earned value and planned value. | Identifies if the project is ahead or behind schedule. |
| Budget Variance (BV) | The difference between the budgeted cost and actual cost. | Tracks financial health and prevents overruns. |
| Resource Utilization | The percentage of billable hours vs. total capacity. | Optimizes engineering team allocation. |
| Submittal Turnaround | Average time to process design approvals. | Measures workflow efficiency and bottlenecks. |
| Safety Incident Rate | Frequency of on-site incidents over time. | Critical for compliance and site management. |
Step 1: Preparing Your SharePoint Data Source
Before connecting to any tools, you must ensure your document management system is architected for high-performance reporting. Structured data is the foundation of any reliable Semantic Model.
- Transition to SharePoint Lists: Get out of the habit of using isolated Excel documents. Lists provide superior version control and a more stable connection for Data Transformation. Unlike flat files, lists allow multiple users to update project logs simultaneously without data corruption.
- Standardization for CAD Management: If you need to manage CAD files in SharePoint, your metadata approach is critical. Standardized columns such as “Part Number” and “Project ID” across all sites. This allows Power BI to connect your technical drawings to financial or procurement logs.
- Proactive Null Handling: The main reason for dashboard failures is the absence of data. Make sure that each entry has a project code and a date stamp. Null data causes incorrect Schedule Variance (SV) and Budget Variance (BV) calculations, which can be misleading.
Step 2: Establishing the SharePoint Power BI Integration
The SharePoint Power BI integration serves as the pipeline that extracts live updates from your cloud environment. Once you authenticate your SharePoint URL, you must enter the Power Query editor to refine the data.
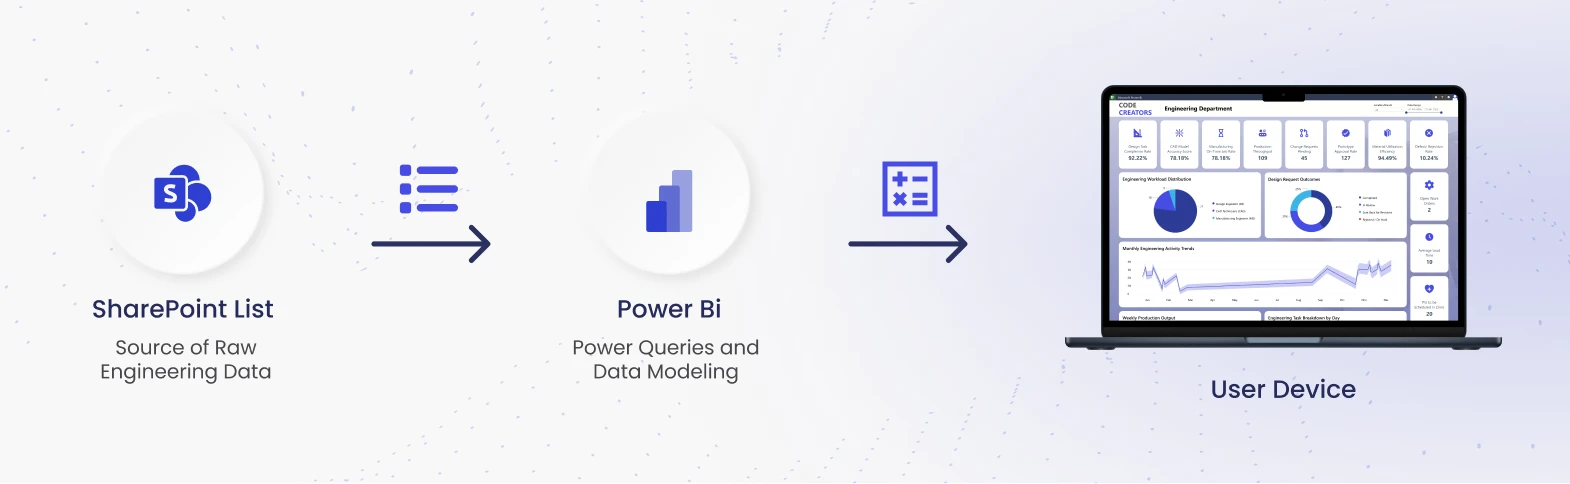
In Power Query, Data Modelling becomes the bridge between raw info and strategic insight. You must transform data types ensuring “Cost” is a decimal and “Date” is a calendar object. This is where you architect a Star Schema. This model separates “Fact” tables (quantitative data like hours billed) from “Dimension” tables (descriptive data like Vendor names). A clean Star Schema is the industry standard for keeping your dashboard fast and responsive.
Step 3: Designing High-Impact Engineering Dashboards
Now that your Semantic Model is clean, you can concentrate on visualizations that exude technical sophistication.

A technical dashboard should be more about clarity than about aesthetics.
- SV & BV Gauges: These are your key tools for the first “pulse check.” By establishing clear goals, you empower managers to quickly determine if a project’s financial path needs correction.
- Advanced Burn-Down Charts: Track design iteration cycles. By charting task completion against your model, you can precisely determine if you will meet critical milestones.
- Mobile Access for the Field: By creating “Mobile-Only” views, you enable site inspectors to access real-time compliance information or safety metrics on tablets right from the construction site. This closes the loop between the design office and the field.
Step 4: Configuring Power BI Data Refresh SharePoint
A stagnant dashboard is a strategic liability. In the engineering sector, failing to report a budget variance in real-time can lead to catastrophic project delays and unrecoverable costs. Setting up an automated Power BI data refresh SharePoint is your essential safeguard.
Because SharePoint Online is a cloud source, you do not need a Data Gateway. A Data Gateway is typically required for on-premises data, like a local SQL server. For SharePoint, you simply schedule the refresh in the Power BI Service. This ensures that when an engineer updates a log, the project manager sees the updated Schedule Variance (SV) almost instantly.
Step 5: Implementing Row-Level Security Power BI
Engineering data is sensitive. You must ensure a junior designer sees technical specs, while the Principal Engineer or CFO sees the full financial Budget Variance (BV) and labor costs.
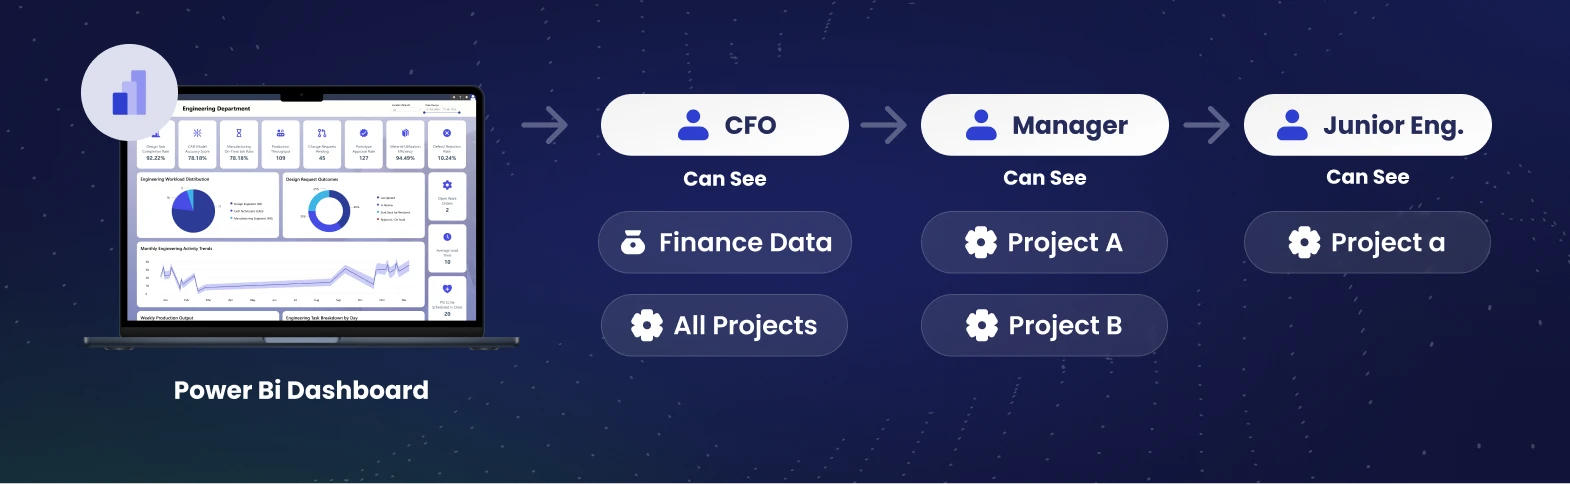
You achieve this using row-level security Power BI (RLS). RLS allows you to define security roles within your Semantic Model. For example, you can create a rule where users in the “Project Manager” group can only see data associated with their specific project ID. This strategic security layer allows for a single, powerful dashboard that serves the entire firm safely.
The ROI of Real-Time Visibility
Firms that move to Power BI and SharePoint engineering dashboards see an immediate return on their investment.
- Reduced Meeting Time: You no longer need “status update” meetings because the status is always live on the screen.
- Faster Decisions: When you see a budget trend heading in the wrong direction on Tuesday, you can fix it on Wednesday, rather than waiting for the end-of-month report.
- Improved Client Trust: Sharing a professional, live dashboard with a client builds immense confidence in your firm’s transparency and technical ability.
Conclusion: Turning Data into a Competitive Tool
Building real-time dashboards grants your firm a strategic advantage. With expertise in the SharePoint Power BI integration, you break down silos and have never-before-seen control over your Project Portfolio Management. You empower your team with reliable Power BI data refresh SharePoint and protect your IP with row-level security power bi.
At Code Creators, we specialize in SharePoint, Power BI, and other Microsoft services tailored for engineering firms. We don’t simply migrate files; we develop smart, high-ROI systems with SharePoint Workflows and Microsoft PowerApps.
Ready to transform your project data into a strategic asset? Our engineers specialize in integrating Power BI for real-time project visibility.