
Power BI makes it easy to turn individual row data into accurate, reliable totals that your team can trust completely. Clear and accurate totals build strong leadership trust and ensure your project meetings remain focused on making great decisions.
Power BI’s unique calculation method is a powerful feature that provides deeper insights than a standard spreadsheet, ensuring your totals reflect the full context of your data. Power BI’s intelligent engine re-calculates your total across the full dataset, providing deeper and more dynamic insights than a simple column sum. This guide provides a clear framework to help you find and fix these calculation errors.
By following a structured troubleshooting process, you can ensure your Power BI incorrect totals fix is accurate and reliable.
Why Dashboard Totals Go Wrong: Understanding the Root Causes
Understanding the “why” helps you unlock Power BI’s precision. Think of it as a powerful, accurate calculator that follows your logic perfectly to deliver exactly the results you define.
Incorrect totals typically stem from five specific areas:
- Filter Context: How DAX recalculates at the total level.
- Summarization: How Power BI “guesses” the math (Sum vs. Average).
- Relationships: How tables talk (or don’t talk) to each other.
- Hidden Filters: The “invisible” settings skewing your results.
- Source Data: Issues living inside your Excel, Jira, or Planner files.
Each of these has a clear, actionable solution. By following a step-by-step methodology, you can move from “guessing” to “knowing” exactly why your numbers aren’t lining up.
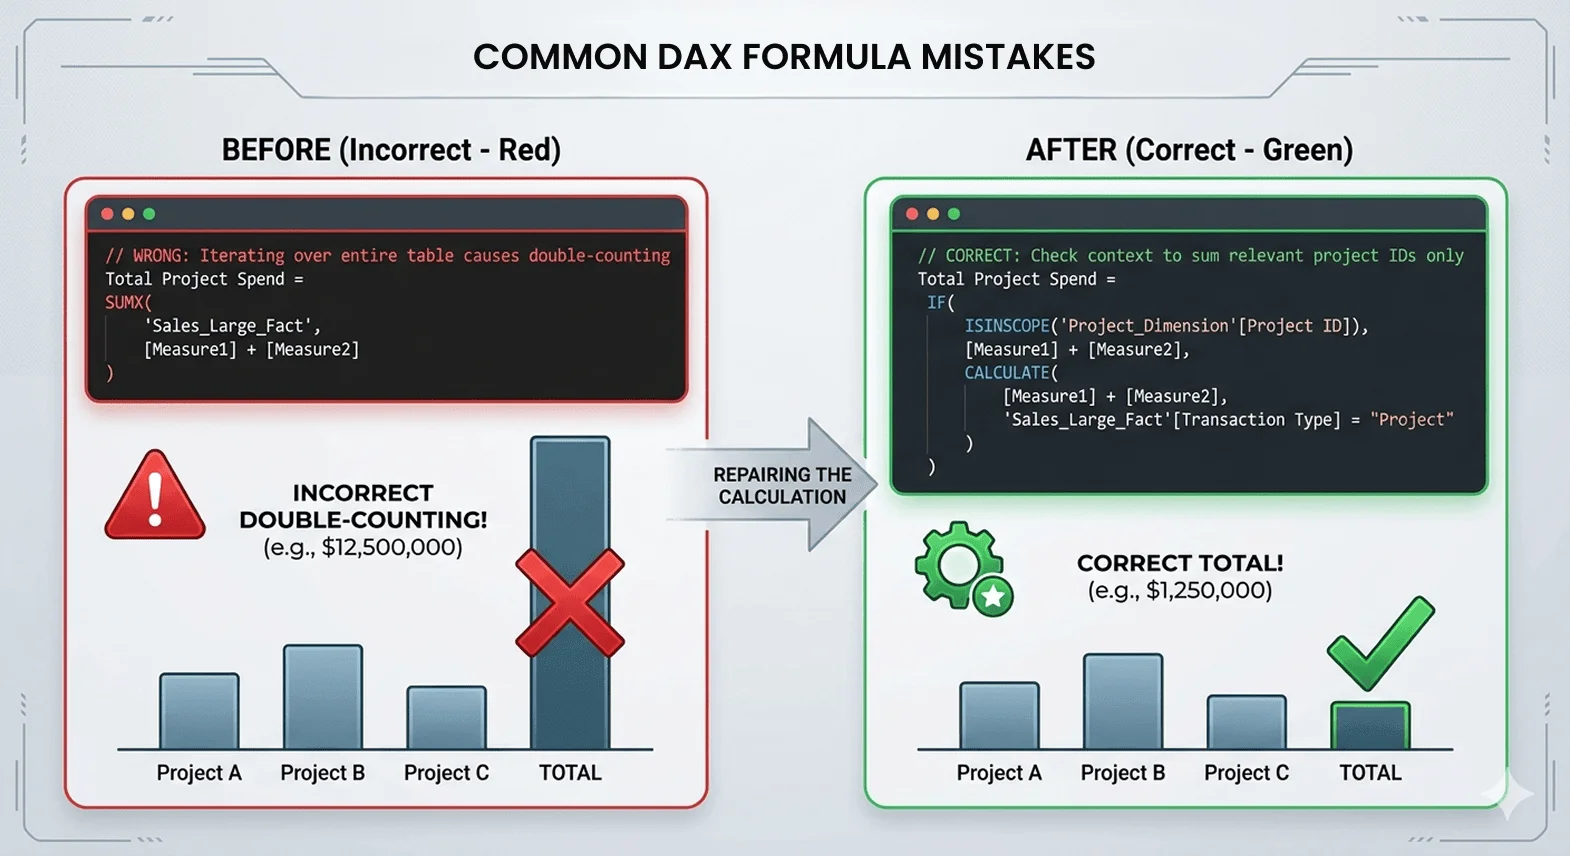
Root Cause #1: DAX Formula and Filter Context Issues
Mastering the most technical aspects of Power BI ensures your sums are always accurate and reliable. Power BI uses “Filter Context” to intelligently update your calculations, ensuring your visuals always reflect the exact data you select.
When a measure calculates the total row, it doesn’t just add up the numbers visible in the rows above it. Instead, it re-evaluates the entire formula for all the data combined. Adjusting your formula ensures your totals calculate perfectly and reflect the true project sum.
The Fix: This might sound complex, but here is the simple version: you need to tell Power BI how to behave when it hits that total row. We often use DAX patterns for project tracking like HASONEVALUE or ISINSCOPE. These act like a traffic cop, telling the formula: “If you are in a specific project row, do the math. If you are in the total row, just sum up the results.”
Root Cause #2: Default vs. Explicit Summarization
When you drag a number like “Project Cost” into a visual, Power BI automatically decides how to aggregate it. Sometimes, it defaults to “Count” or “Average” instead of “Sum.” If your dashboard is showing an average cost in the total row, the final number will look much smaller than it should be.
The Fix: Always verify your aggregation. Click the down arrow next to your field in the “Values” bucket and ensure “Sum” is checked. Better yet, create an “Explicit Measure” (e.g., Total Budget = SUM(Table[Budget])). This tells Power BI exactly what to do, leaving no room for guesswork.
For more complex scenarios, you can use AGGREGATEX functions like SUMX. These functions act as iterators, meaning they look at your data row-by-row, calculate the result for each project, and then add those results together for the total. This ensures Power BI doesn’t skip over specific logic when it reaches the bottom of your table.
Root Cause #3: Data Model Relationship Problems
A healthy data model is the foundation of any reliable report. When you have a Power BI total row wrong, the culprit often hides in how your tables relate to each other. Switching to one-to-many relationships ensures a clean data flow, providing consistent and accurate totals you can always trust.
Marking your “Date Dimension” as a date table and ensuring a strong relationship to your fact table guarantees that time-intelligence calculations stay accurate and reliable. If your project data comes from SharePoint, ensure your data modeling follows Power BI and SharePoint integration guidelines. This keeps relationships clean and reduces the risk of incorrect totals.
The Fix: Check your “Model View.” Ensure your relationships are “One-to-Many” and flow toward your data tables. Stick to one-way filters for the most reliable results and perfectly accurate totals.
Root Cause #4: Hidden Filters and Slicers
Checking for active filters is a quick and helpful troubleshooting step that often leads to an immediate fix. Your dashboard is working perfectly, it’s simply showing you a specific, filtered view of your data.
The Fix: Look for the “Filter” icon on your visual. It will show you exactly what is affecting that number. Check for:
- Page Filters: Is there a filter hiding in the sidebar?
- Slicers: Did someone leave a “Year” or “Status” slicer active?
- Sync Slicers: A filter you set on Page 1 might be haunting your results on Page 5.
Root Cause #5: Source Data Inconsistencies
Sometimes, the simplest explanation is the right one. Ensure your source data is accurate and clean to achieve a perfect match in Power BI. If your source data (from Excel, Jira, or Planner) contains errors, it will dutifully report those errors.
Accurate source data ensures your totals are perfect. By removing duplicates, capturing every expense, and using the right data formats, you create a dashboard that is both precise and reliable.
If you suspect your source data is the issue, it’s time to audit the source directly. For example, use our guides to verify Jira to Power BI integration or Planner integration to ensure the raw data is being extracted correctly before blaming the dashboard.
The Fix: Easily verify your data by exporting it to Excel to ensure every row is accurate, complete, and perfectly aligned with your source.
Your Step-by-Step Troubleshooting Methodology
Ready to apply how to fix Power BI measure totals strategy? Follow this logical process to find the solution fast.
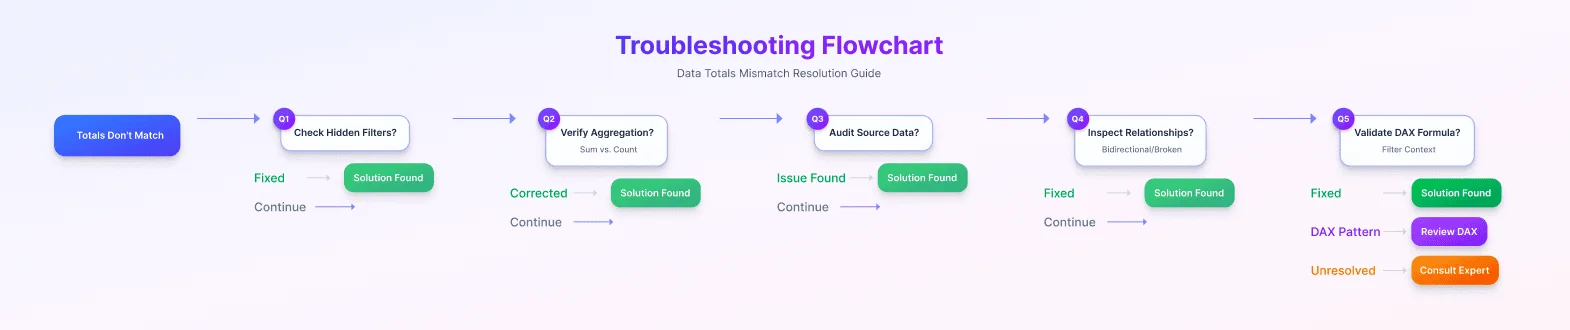
This structured Power BI incorrect totals fix methodology ensures you don’t waste hours guessing at the problem. By following these steps, you will quickly identify the root cause whether it’s a simple filter or a complex DAX formula issue.
FAQs
How do I know if the problem is in Power BI or in my source data?
The fastest way to check is to “Export Data” from a Power BI visual into Excel. If the individual rows in Excel match your source (like Jira or Excel) but the Power BI total row is wrong, the issue is likely your DAX formula or filters. Correcting data at the source ensures every row is accurate, providing a perfect foundation for your dashboard’s success.
What’s the difference between additive and non-additive measures?
Additive measures are simple numbers you can safely add up, like “Actual Spend.” Non-additive measures are ratios or averages, like “Project Margin %” or “Average Task Duration.” You cannot simply sum percentages; you must calculate them using a specific Power BI calculation error fix that re-calculates the ratio at the total level.
When should I use CALCULATE vs. SUMX in my formulas?
Use CALCULATE when you need to change the filters on a specific number (e.g., “Total Spend for only IT Projects”). Use SUMX to easily solve total row errors, it calculates each row accurately and adds them up for a perfect, reliable total.
Can a refresh cycle delay cause incorrect totals?
Synchronizing your refresh schedules ensures all data sources align perfectly, providing a consistent and accurate total across your entire dashboard.
Should I always use many-to-many relationships in my data model?
No. Opt for one-to-many relationships to ensure the most accurate and reliable results. One-to-many relationships with a central “Bridge” table ensure reliable totals and clean data flow, making your dashboard calculations accurate and easy to manage.
Conclusion
Finding a mistake in your dashboard can be stressful but remember, basic troubleshooting solves most of these issues. Accurate totals do more than fix numbers, they build lasting team confidence in your data. There is a massive sense of relief when you can walk into a meeting knowing your reporting is bulletproof.
For many scenarios, the steps above will get you back on track. Scalable data models grow alongside your organization, providing a strong foundation for high-level reporting. If you find yourself facing complex “Many-to-Many” challenges or DAX formulas that just won’t behave, a fresh set of expert eyes can make all the difference.
At Code Creators, we believe your dashboards should be a source of confidence, not confusion. We help organizations move past these technical hurdles through advanced consulting services. Whether you need a quick fix or a complete reporting makeover, we ensure your business outcomes are backed by accurate, high-performing data.
Ready to ensure your dashboards are bulletproof? Let’s discuss your specific scenario and turn those discrepancies into data-driven decisions.