Construction projects are notorious for delays and budget surprises. Smooth deliveries and well-aligned subcontractors improve schedule adherence and support on-time delivery with better control. With clear visibility at every stage, you can spot opportunities early, act fast, and keep timelines tight and budgets right.
What if you could see every project’s health in real time? A Power BI dashboard for construction brings all your project data into one place so you can stay in control and make decisions without delays. A well-designed Power BI dashboard for construction projects delivers real-time visibility across timelines, costs, and resources.
In this guide, you’ll learn what a construction dashboard looks like, which KPIs actually matter, and how you can use them to improve outcomes across your projects. Done right, it turns fragmented data into actionable intelligence and improves stakeholder transparency across every project phase.
Why Construction Projects Need Real-Time Dashboards
Construction project management becomes complex when you’re dealing with changing site conditions, multiple teams, and tight deadlines at the same time. This applies whether you’re a project manager, site supervisor, or general contractor managing multiple active sites. You bring clarity across multiple projects, keeping timelines, teams, and sites aligned and running smoothly.
Common challenges include managing multiple concurrent projects across different locations. Teams often deal with complex budget tracking across labor, materials, and equipment, while also coordinating with subcontractors where delays in one trade can hold up dependent work and push the entire project timeline.
Many teams also struggle to provide clear, real-time updates to clients and stakeholders, especially when project data is scattered across multiple systems. Most teams still rely on spreadsheets and manual reporting. The issue is timing. By the time reports are ready, the data is already outdated and decisions come too late.
In most construction environments, this is an opportunity to improve visibility and gain clearer insight. A real-time dashboard with automated data refresh brings your data together so you can act on current information without delays, even while work is ongoing on-site.
With real-time project tracking, you can monitor project health, track budget variance, and improve coordination across teams and strengthen contractor collaboration, enabling faster decisions and proactive risk identification.
What a Construction Power BI Dashboard Looks Like
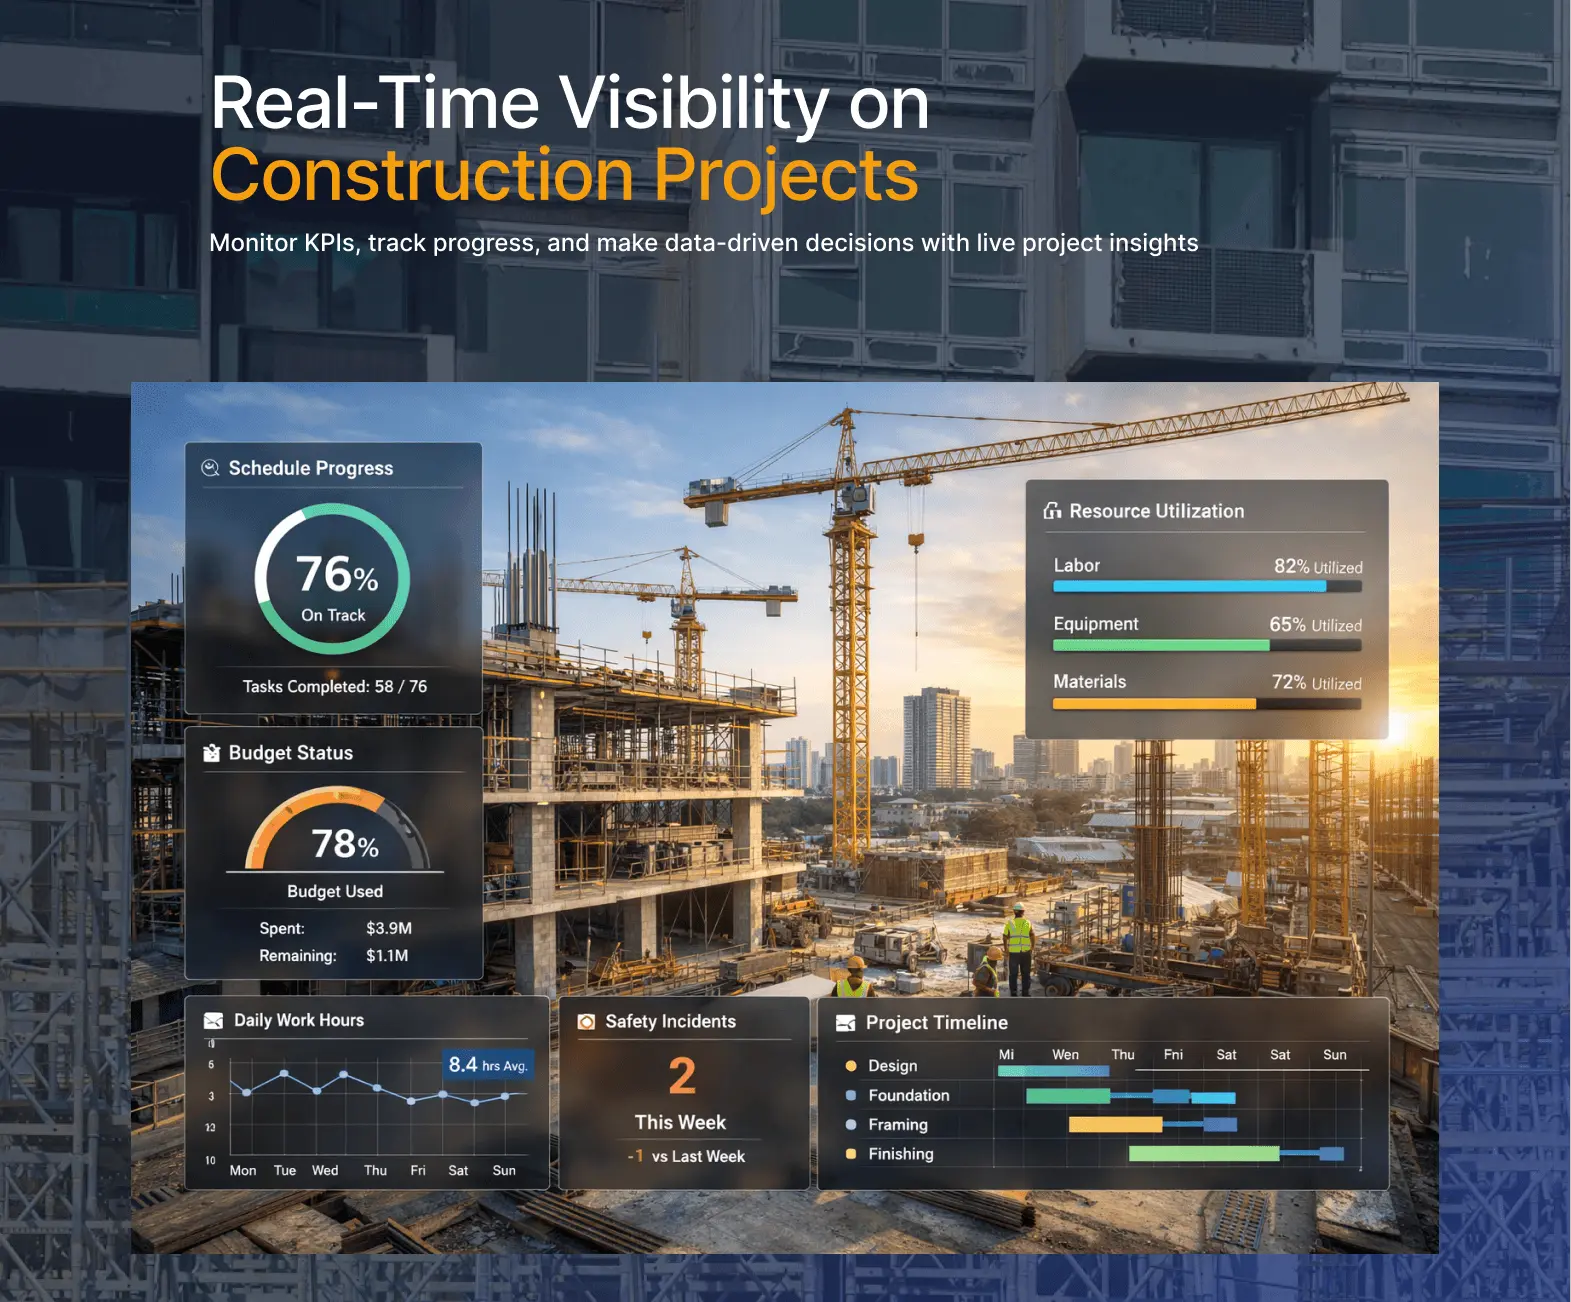
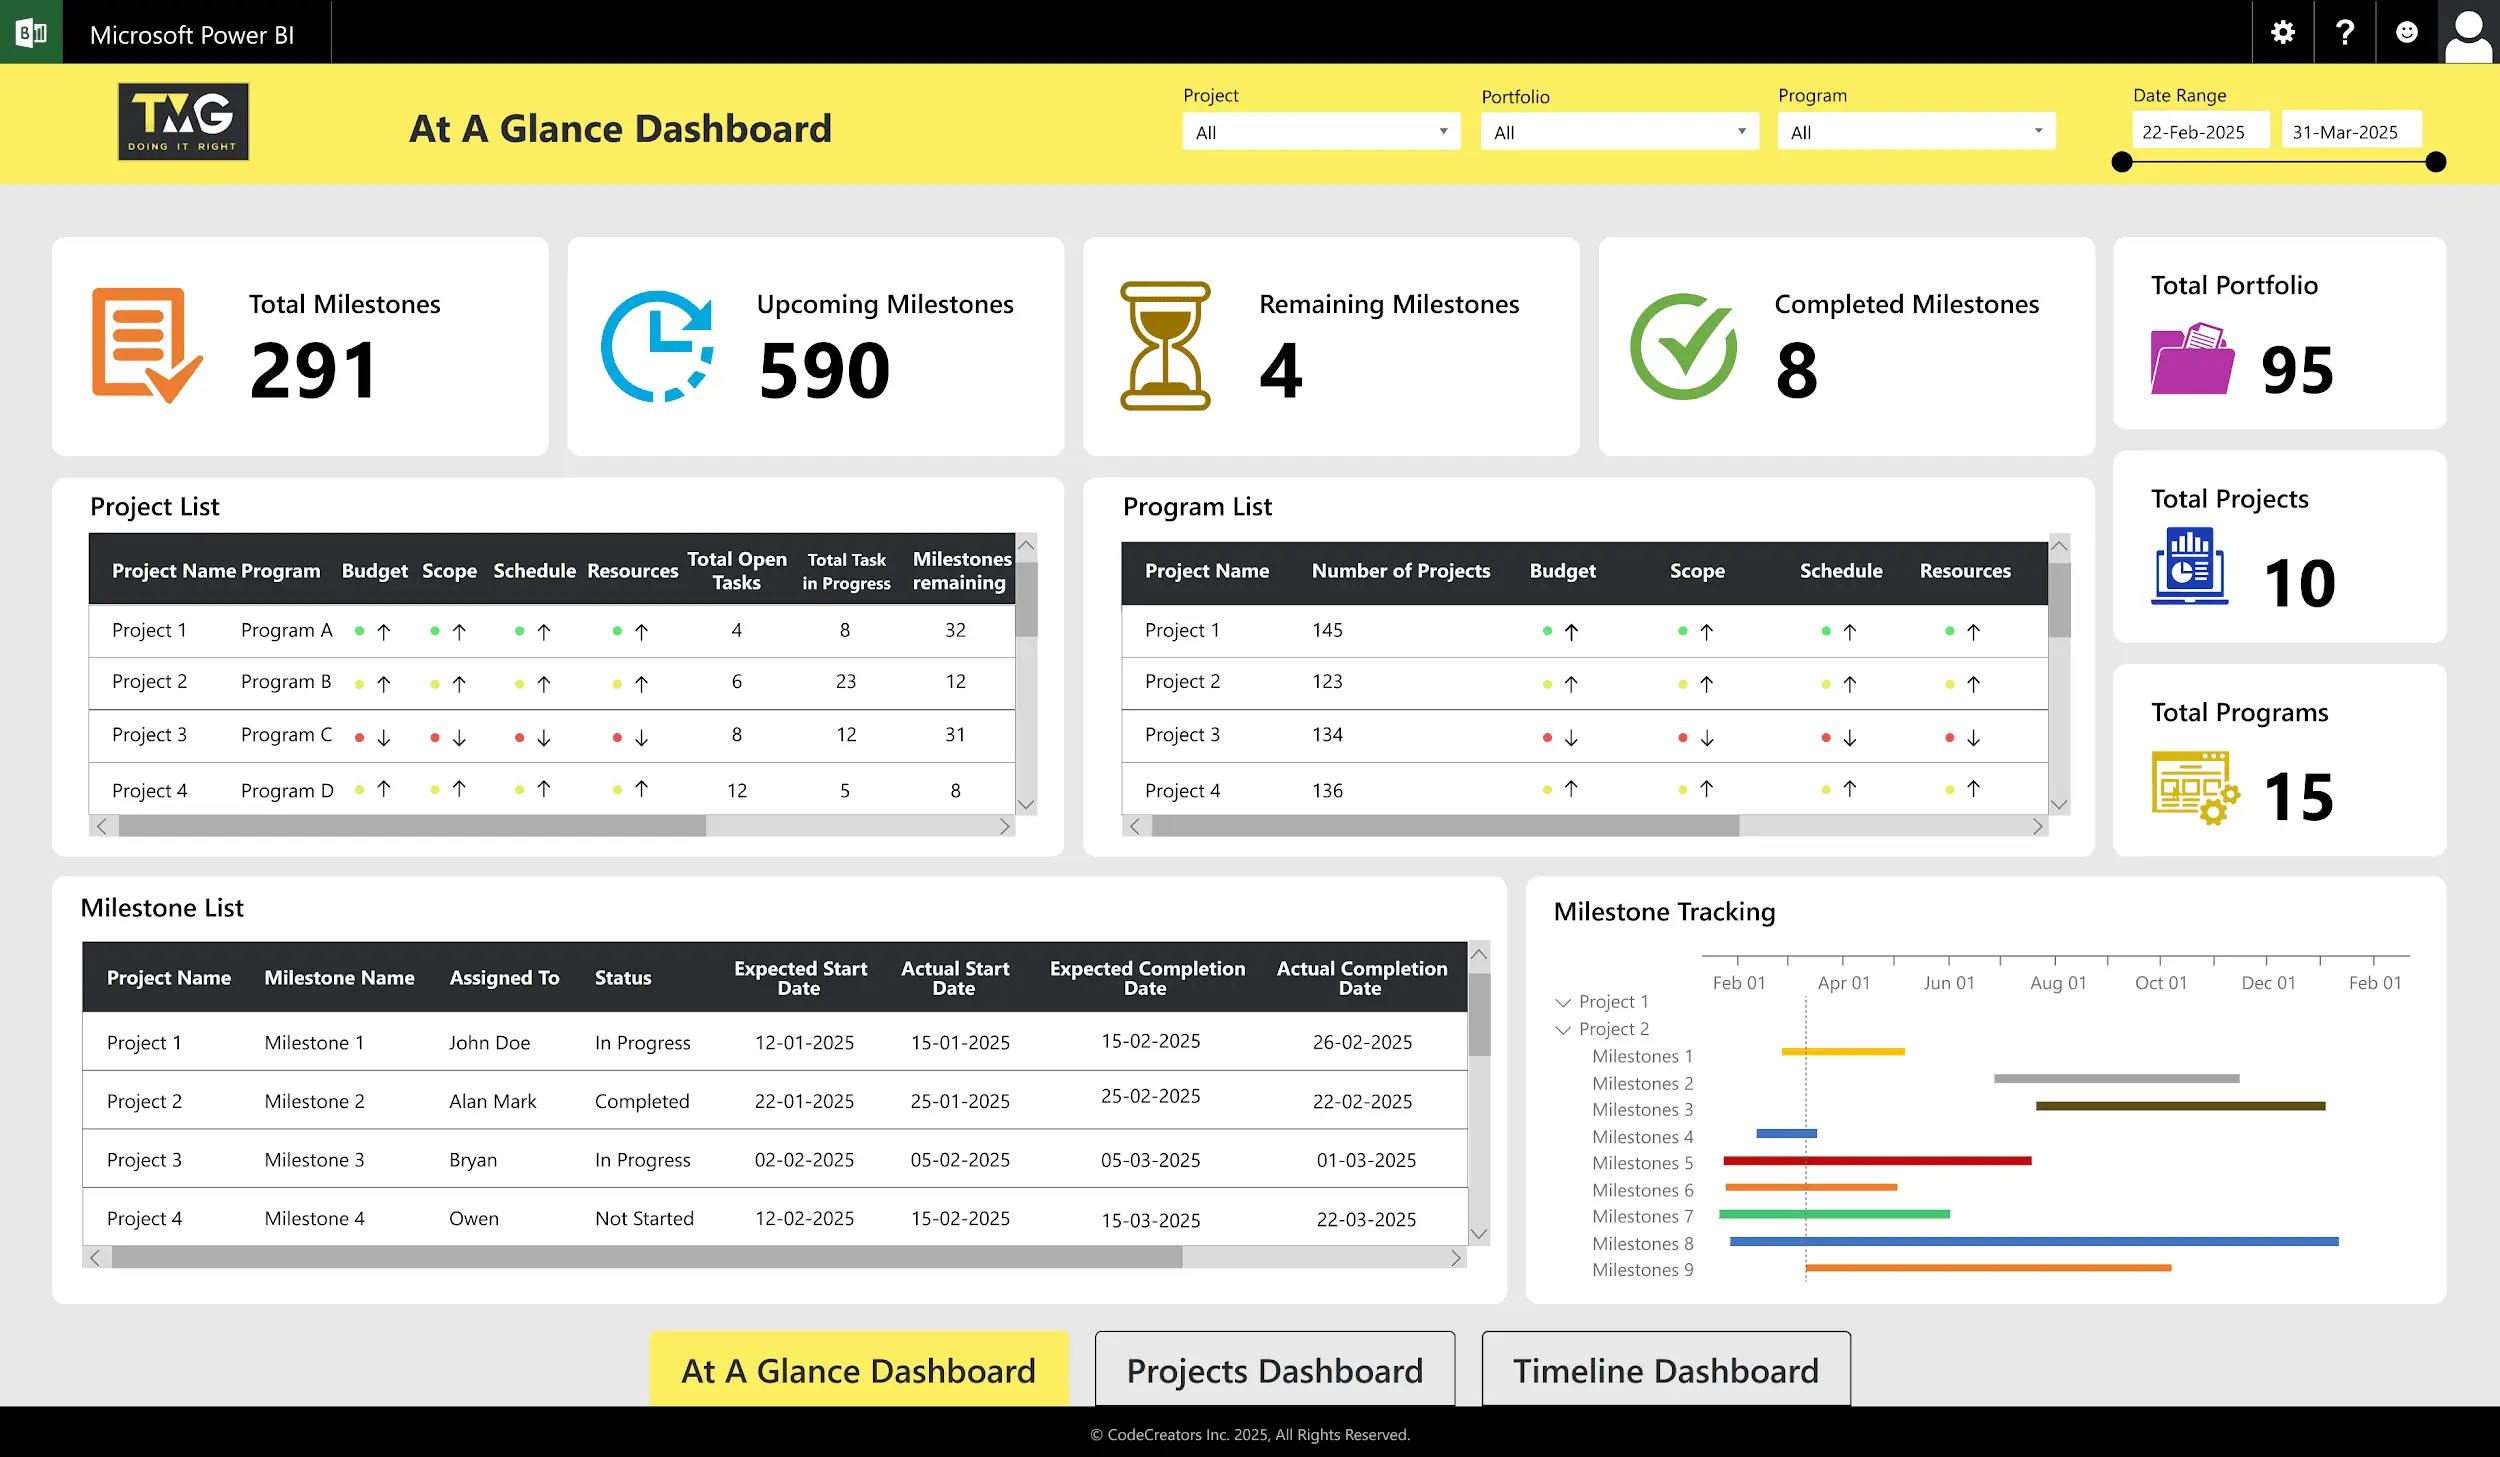
A well-designed construction project management dashboard Power BI is built for quick decisions, not just reporting. Think of it like a site walk. Just as a supervisor can quickly spot delays or issues on-site, a well-designed dashboard should surface problems instantly without digging through reports, helping site supervisors spot delays or issues during daily reviews.
Project Timeline & Milestone Tracking
This provides a clear view of project phases and phase progress by visualizing timelines, tracking milestones, and highlighting delays instantly.
![]()
Many teams use a Gantt chart to better understand task dependencies and schedule impact.
Budget vs. Actual Spending
Budget tracking should clearly compare planned and actual costs across phases. A good dashboard also highlights variance automatically and allows you to drill down into labor, materials, and equipment when needed. You don’t just see overruns, you understand where they originate, which helps you correct issues early before they impact the overall project budget.
Strong budget tracking helps teams act early instead of reacting to overruns later.
Resource Allocation & Utilization
Efficient resource use keeps timelines on track by balancing labor, equipment, and crews, reducing downtime and avoiding overload or idle time. With clear visibility into utilization, you can redistribute work and adjust assignments quickly instead of reacting after productivity drops.
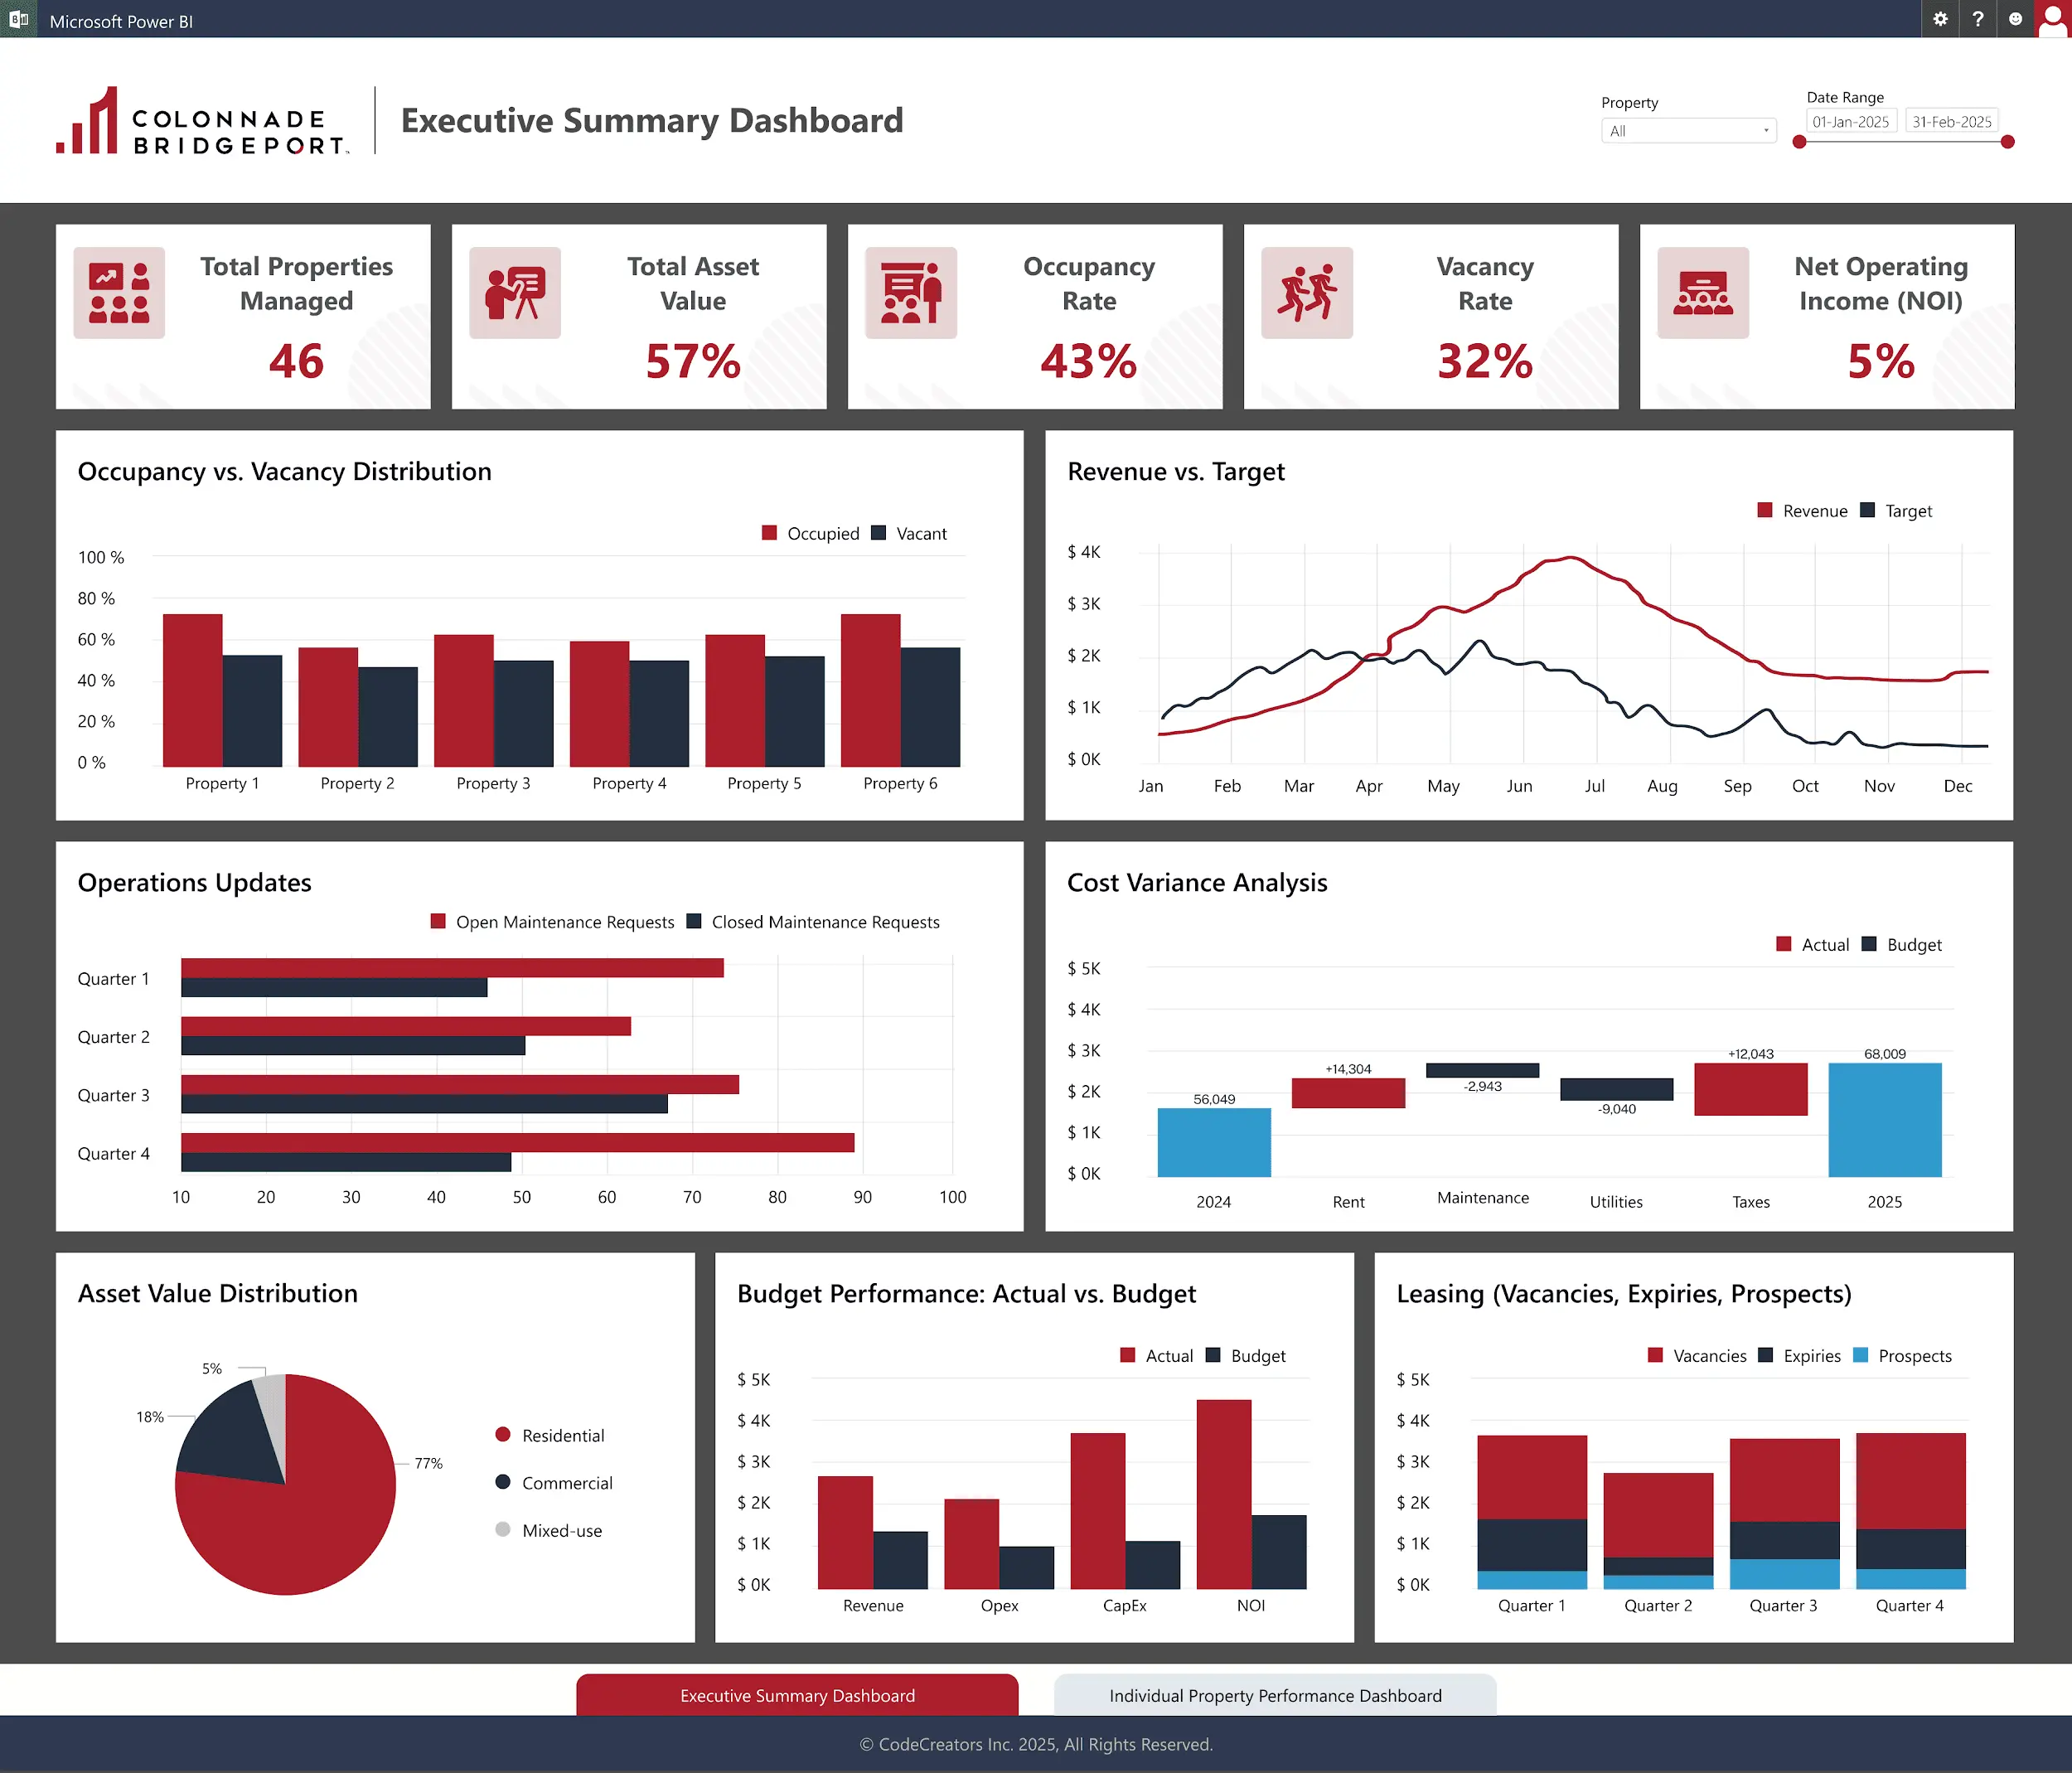
Project Health Indicators
It provides a high-level overview of project health, including schedule status, budget status, and risk flags with issue tracking. This makes it easier to quickly identify which areas need attention so decisions can be made early rather than waiting for problems to escalate.
Clear Power BI visuals, KPI cards, and strong dashboard interactivity make it easy to identify cost overruns or idle resources within seconds, while drill-down capabilities allow deeper analysis so you can act before they affect the project timeline.
Essential Construction KPIs to Track in Power BI
A dashboard should focus on metrics that drive decisions.
Schedule Variance
Shows whether work is on schedule so you can spot delays early and fix them before they grow.
Cost Performance Index (CPI)
Compares actual spending to planned budget. A CPI below 1 signals overspending and requires attention. It gives you a quick financial snapshot so you can evaluate whether the project is staying within budget and act before costs drift further.
Resource Utilization Rate
Measures how effectively labor and equipment are used, including productivity metrics and equipment utilization. This helps maintain a balanced workload, ensuring resources are neither underused nor stretched beyond capacity.
Budget Variance
Shows the gap between planned and actual costs. Flags cost overruns before they escalate.
Project Completion Percentage
Indicates overall progress toward completion and keeps teams and stakeholders aligned.
For deeper tracking strategies, explore additional project management KPIs tailored for construction. You can also track subcontractor performance to identify delays caused by specific teams and improve accountability.
How This Improves Construction Project Outcomes
A mid-sized construction company managing multiple active projects was relying on spreadsheets and manual updates to track progress, costs, and resources across phases from planning and procurement to on-site execution and final delivery. Reporting was time-consuming, and by the time updates were compiled, the data was already outdated. This made it difficult to identify delays, inspection bottlenecks, or budget issues early.
After implementing a Power BI dashboard, all project data was centralized into a single, real-time view. Project managers could monitor schedules, budgets, and resource usage across sites without waiting for manual reports.
The results included:
- Around 25% reduction in schedule delays due to earlier detection of bottlenecks
- Over 60% reduction in reporting time by eliminating manual consolidation
- Improved cost control through early identification of cost variances
- Better resource allocation and more effective resource planning across teams and projects
With real-time task tracking, teams shifted from reactive problem-solving to proactive management, leading to improved coordination, faster decisions, and more predictable project outcomes.
Getting Started with Your Construction Dashboard
Begin by identifying your key data sources, such as project management tools, timesheets, budget systems, and site reports. Centralizing these inputs through proper data integration ensures consistent and reliable reporting across projects.
Next, determine the key metrics that matter most to your operations. Focus on a small set of decision-driven KPIs like schedule variance, budget variance, resource utilization, and project completion percentage, rather than tracking excessive data.
After that, consolidate your data into a structured format that can be used effectively in Power BI. Clean, well-organized data ensures accurate reporting and meaningful insights across all visuals.
At this stage, many construction firms choose to work with specialists who understand both Power BI and construction workflows to ensure accurate, practical reporting.
Finally, pay close attention to dashboard design. Keep visuals simple, clear, and easy to interpret so users can quickly understand project status. A well-designed dashboard improves adoption and ensures that insights are actually used in day-to-day decision-making.
Ready to Transform Your Project Visibility?
Construction teams that adopt real-time dashboards gain a clear competitive advantage through better visibility, faster decision-making, and improved control over schedules, costs, and resources. With centralized and up-to-date insights, it becomes easier to manage multiple projects, reduce delays, and keep budgets on track.
Instead of relying on scattered data and delayed reports, a Power BI project management dashboard helps you monitor project health in real time and respond to issues as they arise. This leads to more predictable outcomes, stronger coordination across teams, and improved stakeholder confidence.
If you’re ready to improve visibility and performance across your construction projects, explore how a tailored dashboard can fit your workflow.
Frequently Asked Questions
Can Power BI integrate with construction project management tools like Procore or Touchplan?
Yes. Power BI connects through APIs, connectors, or data exports. This allows you to centralize data from multiple construction tools into one dashboard.
How long does it take to build a Power BI dashboard for a construction company?
Typically 2-4 weeks, depending on data complexity and integration needs.
What data should we track in a construction Power BI dashboard?
Focus on key construction metrics that support decisions, such as project schedules, budget versus actual costs, labor hours, material costs, safety metrics, and quality indicators.
Is Power BI better than Excel for construction project management?
Excel is useful for basic tracking, but Power BI offers real-time updates, centralized reporting, and better visualization. It is more effective for managing multiple projects and improving stakeholder communication.