Are you still managing project budgets through spreadsheets, emails, and disconnected systems instead of tracking everything in real time?
In practice, this is one of the most common challenges PMOs and finance teams face. A power bi budget vs actual dashboard helps solve this by bringing all financial data into a single, interactive view of project performance. It reduces manual reporting, improves visibility across cost areas, and makes it easier to present clear, reliable insights to stakeholders and executive leadership in a way that supports faster decision-making.
Instead of static reports, Power BI transforms budget data into dynamic dashboards that highlight spending patterns, track performance in real time, and support faster financial decisions.
In this guide, you’ll learn how to build a practical budget vs. actual tracking setup in Power BI, including how to structure your data, connect systems, calculate key metrics, and design dashboards that improve project cost control and decision-making.
Why Budget vs. Actual Tracking Matters (More Than You Think)
In practice, most organizations are already effective at setting structured budgets. The real value comes from clear, real-time visibility into what is happening while projects are in progress. PMOs often manage multiple projects and benefit from timely insights that show how spending aligns with planned costs.
When teams rely on spreadsheets or manual updates, financial information can be delayed. With connected and automated tracking, insights become available earlier, helping teams stay proactive, make adjustments, and maintain better budget control.
For example, a project planned at $200,000 may still appear on track midway. However, if $170,000 is already spent while only 60% of work is complete, it shows an early budget variance, helping teams take timely action and improve spending efficiency.
In short, budget vs actual tracking is not just reporting. It is a control system that improves planning, strengthens financial management, and leads to more predictable project outcomes.
Understanding Budget vs. Actual: The Basics
At its core, budget tracking is about keeping planned budgets and actual outcomes aligned for smarter, more confident decision-making. While simple, it plays a key role in financial control and decision-making.
- Budget represents the planned cost of a project or activity
- Actual represents the real money spent
- Budget variance analysis shows the difference between the two
Consistent budget variance tracking helps monitor financial performance across all project phases. This plays a key role in helping PMOs, finance teams, and executive leadership maintain clear visibility and strong confidence in managing project costs.
For example, if a project has a budget of $100,000 but actual spending reaches $120,000 the variance is $20,000 over budget, providing a useful insight to review spending and improve future budget control. This offers a valuable opportunity to review performance and take timely action to stay aligned with financial goals.
This is similar to a home renovation, where tracking actual costs against the planned budget helps avoid overspending and make timely adjustments.
Not all variances are negative. Small differences (around 2% to 5%) are often acceptable, but larger gaps can indicate risk. A project under budget may still face issues if progress is delayed, while slightly higher spending may be justified if it improves delivery or quality.
By identifying variances early, teams can take corrective actions such as adjusting scope, reallocating resources, or controlling costs. This helps prevent budget overruns and keeps project financials under control.
Over time, tracking budget vs actual improves forecasting, reveals spending patterns, and strengthens cost discipline, supporting better financial project management and long-term budget control.
Data Sources: Where Your Budget and Actual Data Lives
In most organizations, financial and project data is not stored in one place but spread across multiple systems, creating a key challenge when building a reliable Power BI budget vs actual dashboard.
Budget data comes from planning tools or spreadsheets and includes approved budgets, cost categories, and planned allocations. Actual cost data comes from ERP systems, accounting tools, time tracking, or procurement software, reflecting real transactions, invoices, and work hours.
This often leads to issues such as:
- Project names not matching (e.g., “Project Alpha” vs “PRJ-001”)
- Different cost category labels (e.g., “Labor” vs “Manpower”)
- Inconsistent or missing dates
- Project IDs in different formats
This stage also provides an opportunity to streamline data and improve consistency across projects.
Building Your Budget vs. Actual Dashboard: Step-by-Step
Step 1 – Define Your Budget Categories
Start by structuring your budget clearly, including proper budget allocation, categories, and budget codes to ensure accurate tracking and reporting.
Common categories include:
- Labor
- Materials
- Equipment
- Overhead
- Contingency
Tracking the contingency reserve helps manage unexpected costs effectively. Clear categorization improves Power BI project cost tracking, supports better analysis, and ensures accurate reporting across all projects.
Step 2 – Connect Your Data Sources to Power BI
Connecting data sources in Power BI is more than just importing files. It is about creating a stable pipeline that keeps your dashboard updated and reliable.
Power BI supports multiple connection methods including ERP systems, Excel files, and MS Project integration for project scheduling alignment. Many teams still rely on Excel, but Power BI vs Excel shows a clear advantage in automation, scalability, and real-time budget tracking.
- Excel or SharePoint for budget files
- SQL databases for structured enterprise data
- ERP systems for financial transactions
- APIs for cloud-based tools
In most PMO environments, we typically see a combination of these sources, which makes proper data integration critical.
When setting up connections, you typically choose between:
- Import Mode: Data is loaded into Power BI and refreshed on a schedule
- DirectQuery: Data stays in the source system and is queried live
In more complex environments, this is often where organizations benefit from expert support to ensure the data model is structured correctly from the start.
In practice, Import mode is often preferred for performance and flexibility, while DirectQuery is useful when real-time access is critical.
Once connected, automated refresh ensures dashboards stay current and reduces manual effort. For example, a daily or hourly refresh can keep both budget and actual data aligned for accurate reporting.
Step 3 – Create Budget vs. Actual Calculations
Once your data is structured, the next step is to build meaningful calculations that bring insights to life.
At the core, budget analysis in Power BI usually includes a few essential measures:
- Variance = Actual Cost – Budget Cost – This forms the basis of budget vs actual analysis, which helps PMOs quickly identify cost deviations.
-
Variance % = (Variance ÷ Budget) × 100
-
Budget Utilization = Actual Cost ÷ Budget
- Forecast at Completion = Estimated final cost based on current trends
These measures are typically created using DAX formulas in Power BI, allowing dynamic calculations across projects, time periods, and cost categories.
For example, if a project has:
- Budget = $150,000
- Actual = $165,000
Then:
- Variance = $15,000 over budget
- Variance % = 10% over budget
- Utilization = 110%
These simple calculations immediately tell a clear financial story, which is critical for fast and confident decision-making.
What makes Power BI powerful is that these calculations are dynamic. As new data flows in, all metrics update automatically. This enables continuous budget monitoring instead of static monthly reporting.
Over time, these insights also support budget forecasting Power BI, helping teams predict final project costs more accurately.
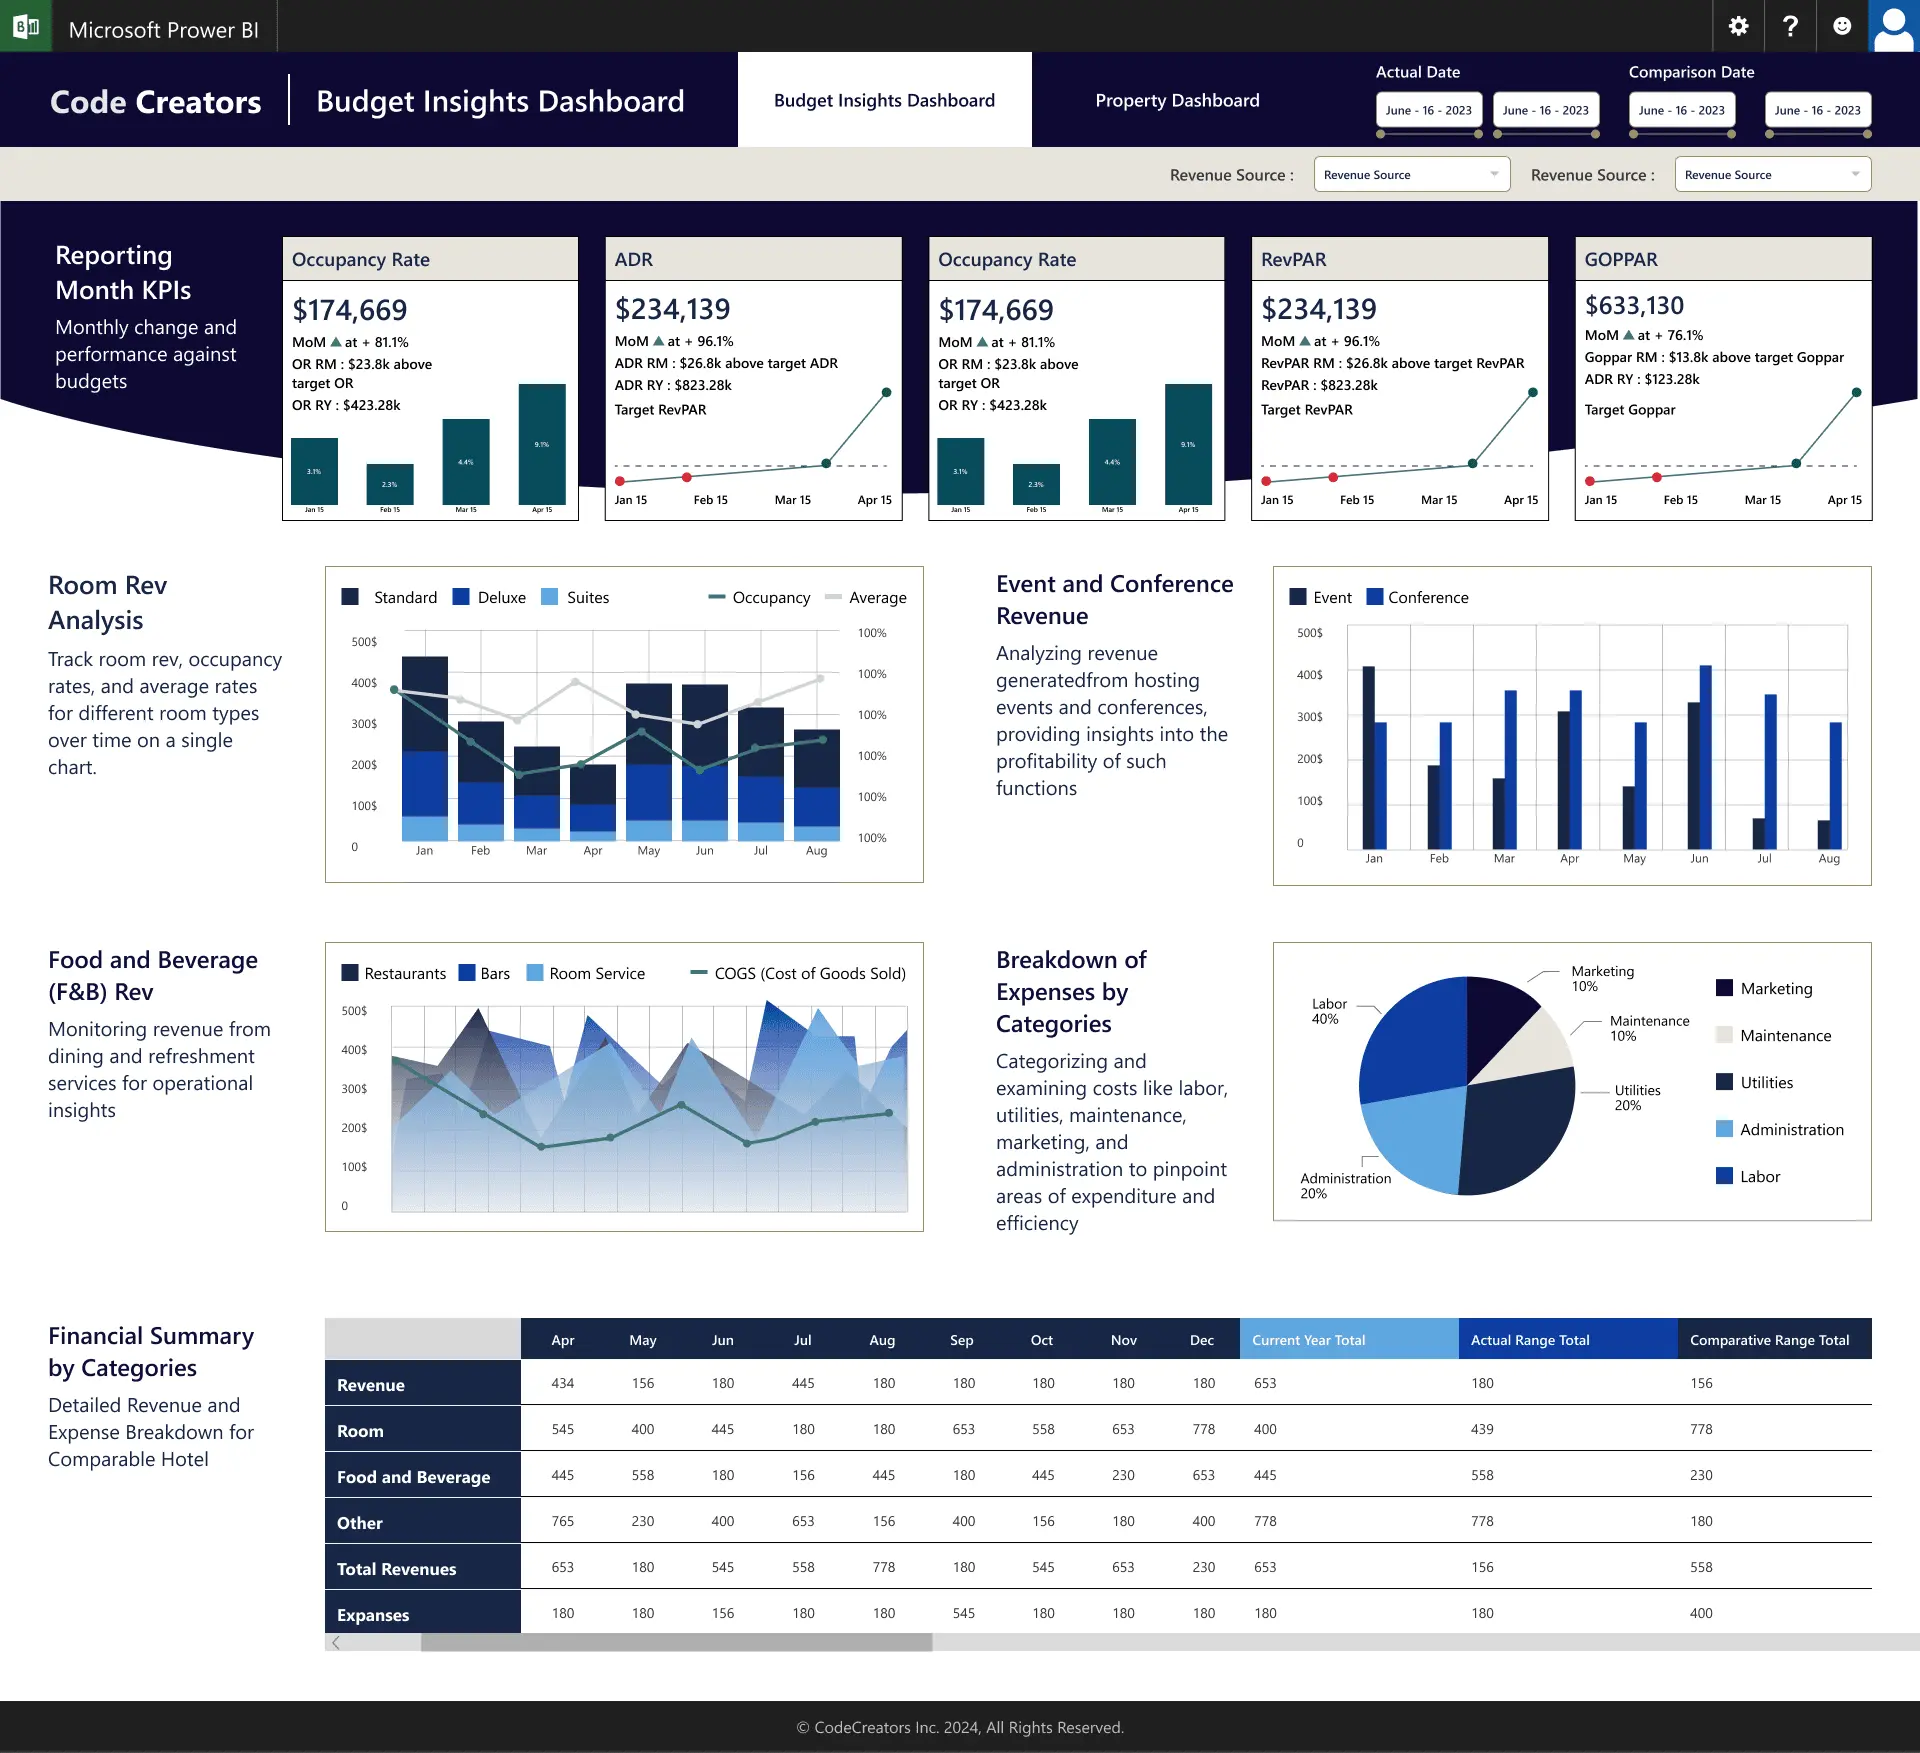
Step 4 – Design Your Visuals for Impact
A strong Power BI financial dashboard is not about showing more data. It is about showing the right data in the right way so decision-makers can understand it quickly.
A good structure usually follows a simple flow:
At the top level, place key KPIs such as:
- Total Budget
- Total Actual Spend
- Variance
- Budget Utilization
This gives executives an instant understanding of financial health.
In the middle section, include trend-based visuals such as:
- Monthly budget vs actual line charts
- Cumulative spending curves
- Forecast trends
This helps you understand how the project is performing over time using different Power BI visuals for budget analysis.
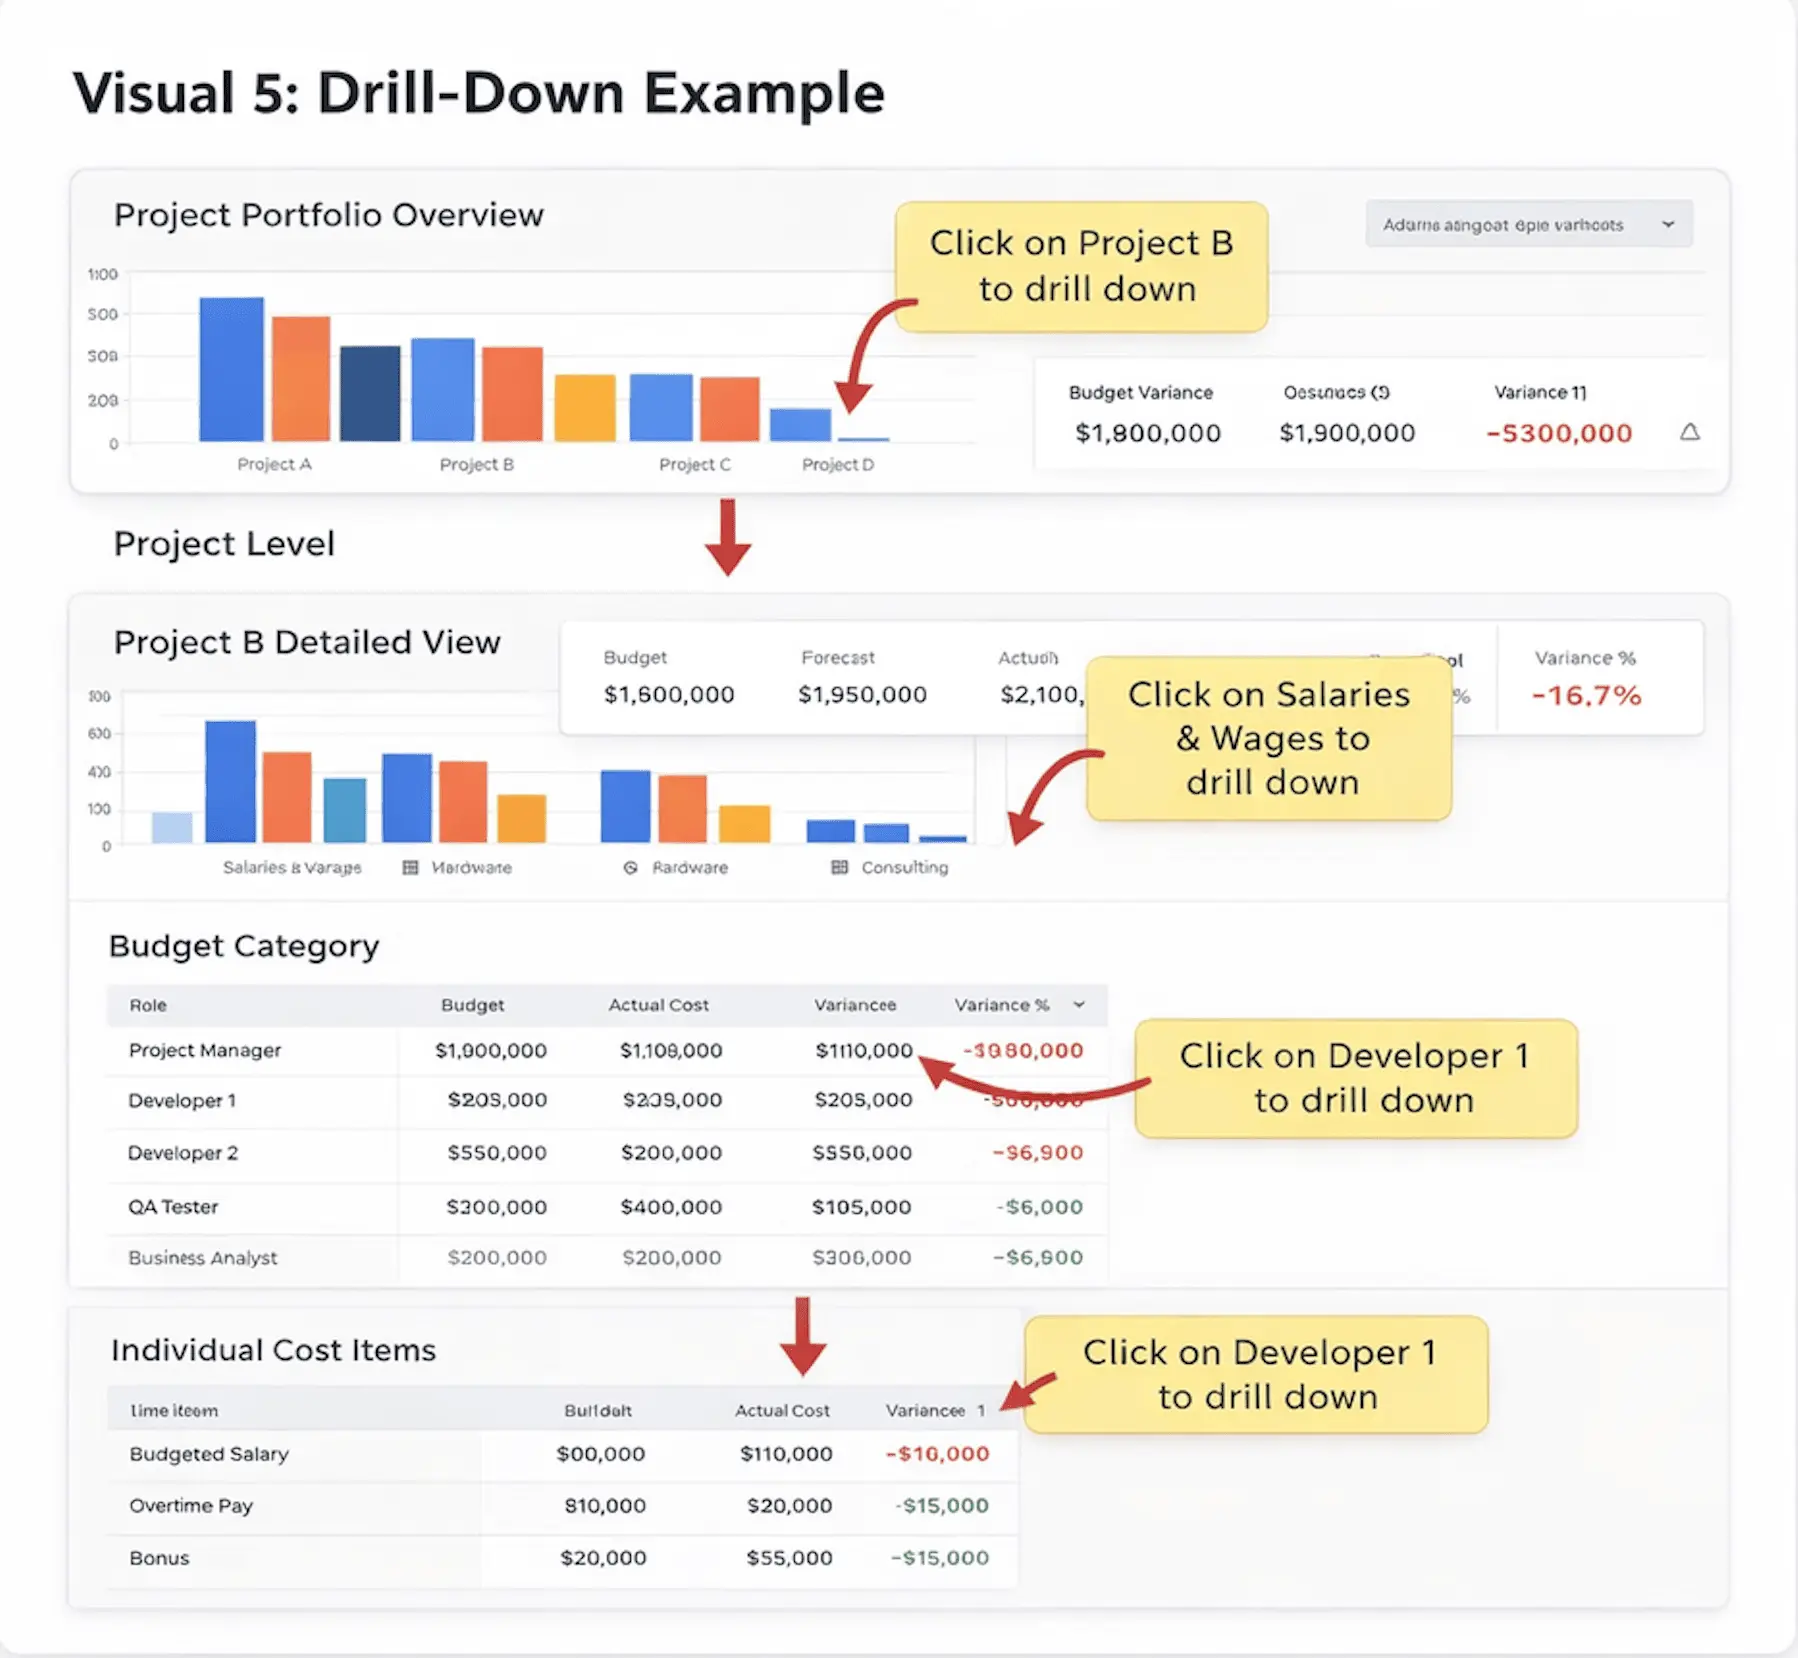
At the bottom level, include detailed breakdowns such as:
- Spending by category (labor, materials, etc.), supporting deeper spending analysis Power BI
- Project or department-level analysis
- Drill-down tables for deeper review
This structure ensures clarity while still allowing detailed exploration when needed.
For PMO reporting, simplicity works better than complexity, especially for senior stakeholders. A clean layout with consistent colors, clear labels, and minimal clutter improves adoption and makes insights easier to trust.
A well-designed Power BI dashboard is interactive, with filters and drill-down features that let users explore data easily. It also uses dashboard automation to keep KPIs and alerts up to date without manual effort.
Key Metrics Every PMO Should Track
A strong Power BI budget vs actual dashboard is only as good as the project management KPIs behind it. Instead of tracking everything, successful PMOs focus on a balanced set of financial and performance indicators that clearly show project health.
1. Core Financial Control Metrics (Must-Have)
These are the most important and should always be included:
- Budget Variance: Shows the difference between planned and actual spending
- Budget Utilization: A key part of budget utilization tracking, indicating how much of the budget has been consumed
- Burn Rate: Helps understand how quickly money is being spent over time
Together, these metrics and consistent budget variance tracking help PMOs determine whether a project is financially on track or drifting away from its approved budget.
2. Forecasting & Predictive Metrics
These help you look ahead instead of only tracking what has already happened:
- Forecast at Completion (EAC): Estimates total project cost at the end
- Remaining Budget Projection: Shows how much budget is likely left
- Trend-based Forecasting: Uses past spending patterns to predict future costs
These insights are especially valuable for long-running or complex projects where early warning signals are critical for control.
3. Efficiency & Performance Metrics
These help evaluate how effectively the budget is being used:
- Cost Performance Index Power BI (CPI): Measures cost efficiency of project work
- Cost per Deliverable: Shows cost efficiency at output level
- Resource Utilization: Tracks how effectively teams or resources are being used
These indicators help PMOs understand whether spending is translating into real value and productivity.
In one case, a mid-sized organization struggled to manage project finances across disconnected systems. Budget data was stored in Excel files, while actual costs were in ERP and accounting tools, making it difficult to get a clear view of overall spending.
Reporting was mostly manual, creating delays in updates and reducing efficiency. Teams spent time consolidating data, while leadership received late insights, limiting effective budget control and timely decision-making.
After implementing Power BI, the organization unified financial data into a single dashboard. Automated tracking replaced manual reporting, real-time alerts flagged overspending early, and budget variance visibility improved cost monitoring. Executive dashboards also gave leadership instant access to project financial performance.
With improved Power BI project cost tracking, PMO reporting became faster, more accurate, and more consistent across projects.
The results included:
- Better cost control
- Faster decision-making
- Fewer budget overruns
- Improved forecasting accuracy
- Stronger trust in financial data
Most importantly, all teams worked from a single source of truth, improving alignment and confidence in financial decisions.
Advanced Features: Taking Budget Tracking to the Next Level
Once the basic setup is in place, Power BI can be enhanced with advanced capabilities to improve control and forecasting.
These include automated alerts for budget breaches (e.g., when budget variance exceeds 10%), helping teams act early. Drill-down features enable detailed analysis of overspending by project, department, or task.
Scenario planning and what-if analysis support testing different budget outcomes before decisions. Role-based dashboards ensure PMs, finance teams, and executives each see relevant financial views.
Integration with project schedules connects time and cost, showing how delays impact budgets. Predictive analytics uses historical data to forecast future spending trends.
These features are powerful but require a solid understanding of Power BI setup and project financial management.
Common Mistakes to Avoid
A well-designed Power BI setup delivers strong results when key practices in budget governance are followed:
- Track budget with context (timeline, scope, risk) for better analysis and project tracking
- Maintain data quality and refresh schedules for accurate, up-to-date reports
- Use a balanced number of visuals to avoid clutter and improve clarity
- Involve stakeholders early to ensure adoption and alignment with PMO and finance teams
- Define clear budget codes and categories for consistent cost tracking
- Set alerts for budget variance thresholds to enable early cost control
- Provide training to help teams interpret budget data effectively
These practices help build a reliable, efficient, and scalable Power BI budget tracking system.
Getting Your Team Aligned: Adoption Tips
Even the most effective dashboard delivers strong value when users are confident and comfortable using it. Successful adoption is driven by simplicity, clarity, and active collaboration across all stakeholders.
- Start with a focused set of key metrics to keep dashboards simple, clear, and user-friendly
- Involve finance, PMO, and project teams early in the design process to ensure strong alignment and ownership
- Provide training on interpreting variance data and making informed, timely decisions
- Set clear thresholds for when budget issues should be escalated to leadership to support proactive management
- Keep the dashboard simple, accessible, and easy to navigate for all users
- Celebrate early wins to build confidence and encourage adoption
- Gather feedback regularly and improve the dashboard based on real user needs
When users see clear value in reducing manual work and improving decision-making, adoption becomes significantly easier.
Ready to Take Control of Your Project Budgets?
A well-designed Power BI budget vs actual dashboard can significantly improve how organizations manage project finances. While basic setups work well for smaller teams, organizations managing multiple projects, complex budget structures, or strict financial governance often need a more advanced and scalable approach.
In these situations, working with the right experts can make a real difference. Code Creators specializes in building custom dashboard solutions tailored to real-world PMO and financial challenges. From integrating data across multiple systems to enabling automated reporting and accurate forecasting, their solutions are designed to match how your organization actually operates.
If you are looking to move beyond manual reporting and build a fully automated, enterprise-grade budget tracking system, you can explore our Power BI dashboard services to see how we can support your requirements.
With a strong focus on accuracy, scalability, and usability, Code Creators helps organizations gain complete visibility into project financials and make better decisions with confidence.
Frequently Asked Questions
How often should budget vs actual data be refreshed in Power BI?
Most PMOs use a daily refresh to keep data reliable and up to date. For fast-moving projects, multiple refreshes per day can work even better.
Can Power BI handle multiple projects and financial systems together?
Yes. Power BI can combine data from ERP systems, Excel, and project tools into one dashboard. As long as you have common fields like Project ID or Cost Center, everything can be connected and analyzed in one place.
What is the difference between budget variance and CPI?
Budget variance shows the difference between planned and actual cost. CPI shows how efficiently money is being spent. Use variance to spot over or under spending, and CPI to understand cost efficiency.
Do all users need a Power BI Pro license?
Not always. If you are using shared workspaces under Pro, then yes. But with Power BI Premium, many users can view dashboards without individual Pro licenses.
How do I set up budget overrun alerts in Power BI?
You can set alerts directly on key KPIs like budget utilization or variance. When thresholds are crossed, Power BI can notify you or trigger alerts through Power Automate.