Most Jira reports show activity, not performance. Teams see issue counts and status updates, but stakeholders still struggle to understand delivery risk, sprint efficiency, and true project health. For project managers, data analysts, and IT leaders, exporting Jira data into spreadsheets becomes an efficient process that, once streamlined, allows quick cleaning, reconciling, and building of reports that provide a complete and accurate story.
This is where Jira and Power BI together become powerful. By integrating Jira with Power BI, you move beyond static reporting and build a real-time, interactive Power BI project management dashboard that highlights agile metrics such as sprint velocity, burndown progress, issue distribution, and priority tracking in one executive-ready view. Instead of chasing updates, your team gains immediate clarity.
In this guide, you will learn exactly how to connect Jira to Power BI, structure and transform nested data in Power Query, handle custom and multi-value fields correctly, troubleshoot common integration challenges, and optimize performance for scalability. By the end, you will not only build dashboards , you will understand how to design reporting systems that leadership can confidently rely on.
Why Connect Jira to Power BI?
Integrating Jira with Power BI unlocks a host of benefits for project-driven teams:
- Near Real-time project tracking: Move beyond static spreadsheets and see data refreshed automatically on a schedule. Many teams exploring Power BI vs Excel find that Power BI handles large datasets, real-time updates, and visual dashboards far more efficiently. Keep your team aligned and stakeholders informed effortlessly.
- Single source of truth: Centralize your project metrics to ensure consistency across reports, dashboards, and teams.
- Better decision-making and insight into agile metrics: Interactive visualizations not only make complex project data accessible, but also highlight critical agile metrics such as sprint velocity, burndown progress, and issue status distribution. Teams can quickly see which sprints are on track, identify bottlenecks, and make data-driven decisions that improve workflow efficiency.
- Time savings: Automate repetitive reporting and focus your efforts on strategic project management tasks rather than compiling data manually.
- Visual clarity: Present complex Jira data in ways that are immediately understandable, enhancing collaboration and communication.
With Jira Power BI integration, your dashboards become more than just reporting tools; they transform into instruments of insight, empowering teams to act quickly, spot trends, and drive project success.
Your Step-by-Step Guide to Connect Jira to Power BI
This section provides a practical, hands-on walkthrough to connect Jira to Power BI and build dashboards that deliver measurable results.
Before You Start: What You’ll Need
To ensure a smooth setup, gather the following:
- Power BI Desktop installed (latest version recommended for full feature support).
- Jira admin permissions or appropriate access to the projects and issue types you want to track.
- Jira site URL, username, and API token (for Jira Cloud) or credentials for Jira Server.
- A clear understanding of your Jira project structure and workflows. If your organization uses SharePoint for project data storage or collaboration, consider integrating Jira with custom SharePoint solutions to streamline data management and reporting.
- A list of specific projects, boards, or issue types relevant to your reporting objectives.
Having these prepared will streamline setup, reduce errors, and accelerate dashboard creation, making your data immediately actionable.
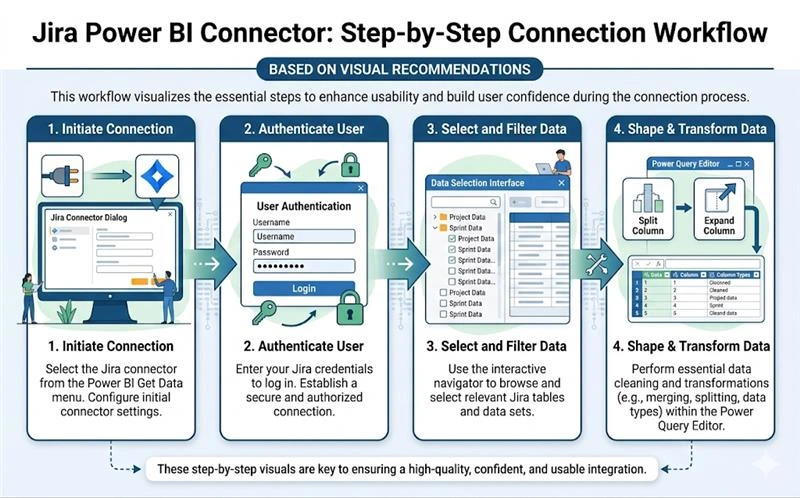
Step 1: Using the Jira Connector in Power BI
- Open Power BI Desktop
- Navigate to Get Data → Online Services → Jira
- Enter your Jira URL and select your authentication method.
Why This Matters
The Jira connector simplifies importing your project data and ensures it is structured correctly. Filtering only the projects you need keeps dashboards fast and actionable, prevents clutter, and avoids overwhelming your stakeholders with irrelevant data. In practice, effective dashboards succeed when data is imported with intention.
By focusing on disciplined data selection, dashboard performance improves, and stakeholders gain confidence in the numbers, making project reporting stronger and more reliable.
Real-World Example
The fields.sprint field often appears as nested data, and expanding it ensures sprint progress and velocity metrics accurately reflect reality. Properly handling multi-value fields like Labels or Components enhances filtering and analysis, delivering precise and reliable counts.
Common Challenge We See
Teams often import all Jira projects by default. This creates slow dashboards and diluted insights. Focused selection improves performance and clarity.
Expert Tips
- For Jira Cloud, use API tokens for secure, reliable authentication and seamless refreshes.
- If managing multiple agile boards, create separate queries for each board and combine them in Power Query. This keeps dashboards organized, fast, and scalable.
- Avoid importing archived projects unless needed for historical reporting.
Positive Framing
By selecting relevant projects and handling fields correctly, your team can monitor progress effortlessly and make data-driven decisions with confidence.
Step 2: Authenticating and Selecting Your Data
- Authenticate securely:
- Jira Cloud: Use API token
- Jira Server: Use standard credentials
- Select only relevant projects, boards, and issue types
- Choose available fields carefully: status, assignee, priority, story points, sprint details, and custom fields
- Optimize performance: skip historical or irrelevant issues
Why This Matters
Selecting the right data ensures dashboards are responsive, meaningful, and actionable. Handling null values in Story Points, for example, prevents skewed sprint velocity calculations and ensures accurate reporting.
Velocity and burndown metrics become highly reliable when supported by accurate data. Ensuring all story points are correctly recorded helps executive reporting stay precise and enables confident, well-informed planning decisions.
Real-World Scenario
For a team managing multiple active sprints across different boards, choosing only the current sprints prevents clutter and provides a clear picture of ongoing work. Including only essential custom fields keeps reports focused and actionable.
Common Challenge We See
Many teams try to pull all historical issues at once, which slows dashboards and makes filtering difficult.
Pro Tips
- For larger Jira instances, use incremental refresh to keep dashboards up to date without long load times.
- Flag or replace null story points to maintain reliable metrics.
- Apply filters for active sprints or high-priority projects to reduce noise.
Positive Framing
With focused data selection and clean authentication, your dashboards become real-time tools that your team can trust and rely on for project success.
Step 3: Transforming Your Data in Power Query
Power Query transforms your Jira data into actionable insights. Proper transformations make dashboards faster, more accurate, and highly reliable.
Step-by-Step Transformations
- Expand nested columns thoughtfully (e.g., Sprint, Custom Fields)
- Split multi-value fields like Labels or Components into separate rows
- Convert Created, Updated, Resolved, and Due Date columns into proper Date/Time format
- Create calculated columns:
- Resolution Duration = Resolved Date − Created Date
- Days Open = Today − Created Date for unresolved issues
- Sprint Length = Sprint End Date − Sprint Start Date
Why This Matters
These transformations allow precise calculation of sprint velocity, burndown, and cycle time metrics. Accurate modeling ensures dashboards reflect true project performance, making them a trusted tool for decision-making. This stage separates basic dashboards from professional reporting systems. Careful modeling, relationship management, and calculated columns transform raw issue data into operational intelligence that leadership can confidently act upon.
In larger environments, this often means separating issue data into a central fact table and linking it to dimension tables such as sprint, user, and project. This star schema approach improves performance, simplifies DAX calculations, and ensures that metrics like sprint velocity and cycle time remain accurate even as data volume grows.
Real-World Scenario
If an issue has 3 labels, expanding them ensures each label counts correctly toward metrics without duplication. Large datasets can slow dashboards; separating supporting tables and creating relationships keeps dashboards fast and scalable.
Common Challenge We See
Teams often import all historical data without splitting multi-value fields. This leads to slow dashboards and inaccurate counts.
Practical Tips
- Standardize status values across projects for clear, consistent reporting (e.g., “In Progress” vs “Development”).
- Handle null story points consistently to achieve accurate and reliable velocity tracking.
- Filter out archived projects and unused fields to keep dashboards fast, smooth, and highly responsive.
- Use model relationships for supporting tables to improve performance on large datasets.
Positive Framing
By preparing your data thoughtfully, dashboards become clear, actionable, and empowering. Teams can confidently track progress, identify priorities, and make informed decisions that drive success.
Common Challenges You Might Face (and How to Solve Them)
Even with a smooth setup, some scenarios require attention. Here’s how to address them proactively:
Handling Complex Jira Data Models
Jira often contains nested fields, subtasks, and custom fields, which can complicate reporting:
- Flatten nested structures for easier analysis in Power BI.
- Map and standardize custom fields for consistent metrics across projects.
- Maintain data consistency to ensure your dashboards reflect accurate project status.
Addressing complex data positively enables richer dashboards and more powerful insights into project health and team performance.
Navigating API Limitations and Data Refresh
Jira API rate limits can affect how much data you pull and how often:
- Understand the difference between scheduled refresh and near-real-time updates.
- Optimize queries and remove unnecessary fields to stay within API limits.
- For large datasets, consider incremental refresh to improve performance while keeping dashboards up to date.
For organizations with more than one million rows of issue history, incremental refresh is not optional. It becomes essential for maintaining performance while preserving historical accuracy across multiple reporting periods. These strategies ensure your dashboards remain responsive, reliable, and always ready for decision-making.
Troubleshooting Connection Issues
Some common connection challenges can be quickly resolved:
- Verify Jira permissions to confirm access to the required projects and fields.
- Check firewall or VPN settings to allow Power BI to access Jira endpoints.
- Use API tokens instead of passwords for secure and reliable authentication.
By proactively addressing connection issues, you maintain continuous, real-time insights for your team and stakeholders.
What’s Possible? An Example Jira Power BI Dashboard
Imagine a fully connected dashboard providing immediate, actionable insights:
- Sprint velocity: Monitor team output and predict completion times.
- Issue status distribution: Quickly identify bottlenecks and work progress.
- Burndown progress: Track sprint completion trends visually.
- Resolution times: Identify efficiency gaps and improve response times.
- Priority tracking: Highlight high-priority tasks to focus team efforts efficiently.
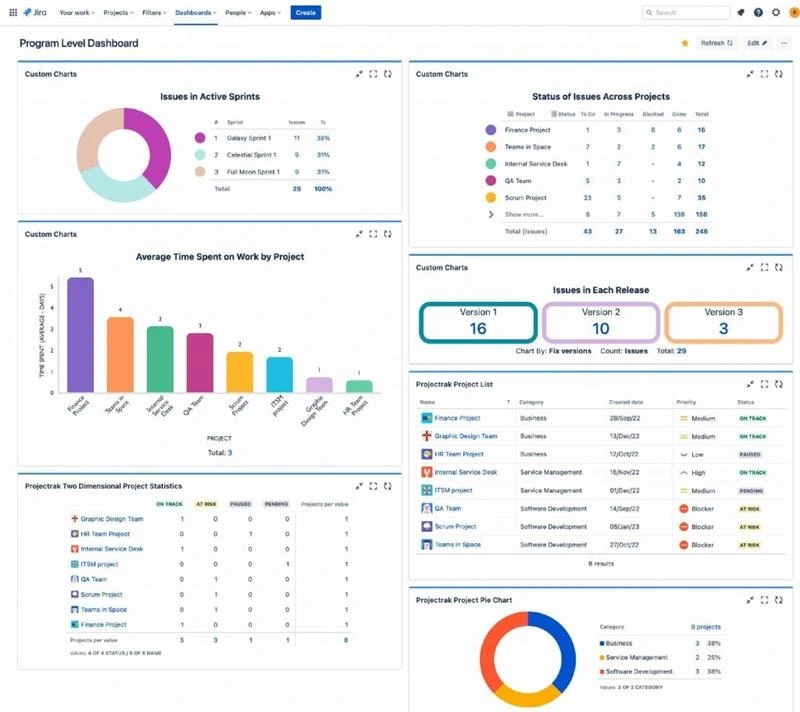
These insights help teams monitor critical project management KPIs and maintain full visibility into delivery performance. The interactive visualizations provide a single source of truth for project reporting.
Need a More Powerful, Automated Solution?
DIY integration works well for initial dashboards, but larger teams or complex projects benefit from professional implementation:
- Large teams managing multiple projects and boards.
- Complex data structures with numerous custom fields.
- Real-time updates for ongoing sprints and tasks.
- Advanced metrics for executive dashboards and KPIs.
| Feature / Scenario | DIY Integration | Professional Implementation |
| Team Size | Ideal for small teams or individual projects, perfect for getting started quickly. | Best for large teams managing multiple projects and boards efficiently. |
| Data Complexity | Works well with simple datasets and minimal custom fields. | Handles complex data structures and numerous custom fields with ease. |
| Real-Time Updates | Basic updates; manual refresh keeps you in control. | Automated, near real-time updates ensure your dashboards always reflect current project status. |
| Metrics & KPIs | Provides foundational insights and essential metrics. | Delivers advanced metrics, executive-ready dashboards, and tailored project management KPIs. |
| Setup Effort | Fast setup with minimal learning curve. | Professional setup ensures optimized performance, scalability, and long-term reliability. |
| Long-Term Maintenance | Requires manual updates, suitable for small-scale reporting. | Automated refreshes and enterprise-grade reliability reduce effort and maximize accuracy. |
| Ideal For | Beginners exploring Power BI dashboards. | Organizations aiming for high-impact, accurate, and scalable reporting solutions. |
Many organizations start with a basic setup and later realize their reporting cannot scale across departments, boards, or leadership requirements. Code Creators’ custom Jira Power BI dashboard services are designed for teams that need structured data models, automated refresh strategies, and executive-ready KPIs aligned with business objectives.
Instead of maintaining reports manually, your organization benefits from a performance-focused reporting framework built for long-term reliability and growth.
Frequently Asked Questions
Can I connect Jira Cloud to Power BI, or does this only work with Jira Server?
Both Jira Cloud and Server are supported. API tokens are recommended for Cloud, and standard credentials work for Server. Integration is secure and comprehensive across both platforms.
How often does the data refresh from Jira to Power BI, and can I make it update in real-time?
Scheduled refreshes are standard, near real-time updates are possible within API limits. True live streaming would require advanced configuration or third-party solutions. Optimizing queries and using incremental refresh improves dashboard responsiveness.
Are there alternatives to the default Jira connector, and which method is best?
Options include direct API integration, third-party connectors, and OData feeds. The Jira connector is generally efficient, reliable, and suitable for most reporting needs.
What kind of reports and dashboards can I build with Jira data in Power BI?
You can build sprint velocity charts, burndown charts, backlog reports, issue tracking dashboards, executive summaries, and dashboards with custom KPIs tailored to your projects.
What happens if I have custom fields in Jira; can Power BI display them?
Yes. Custom fields can be imported, mapped, and visualized. Nested or complex fields can be flattened and transformed, ensuring that your dashboards capture every unique project metric.
Conclusion
Connecting Jira to Power BI transforms static project data into interactive, real-time dashboards, giving teams clear visibility into sprint progress, issue status, priority tracking, and overall project health. While a DIY setup works for small teams, larger organizations with multiple agile teams or complex workflows often need professional support to ensure accuracy, scalability, and efficiency.
For a reliable, enterprise-ready solution, explore our custom Jira Power BI dashboard service. With Code Creators’ expertise, your team can focus on strategic project management rather than manual data handling, confidently turning Jira data into actionable insights and high-quality reporting.